Este artículo también está disponible en español.
Shiba Inu (SHIB) is now priced at about $0.00001783, just below a key resistance zone which means that the market is in a good mood. Market analysts are ready to witness another possible rally in the meme coin space.
Related Reading
Crypto influencer Davinci Jeremie noted that during the last bull cycle, Dogecoin (DOGE) reached a market cap of $88.8 billion, while SHIB peaked at $40 billion. The bull run will take the market cap of meme coins to a trillion dollars.
Last cycle we saw $DOGE coin hit $88.8 billion market cap & $SHIB hit $40 billion.
I think we’ll see memes as an asset class hit close to $1 trillion market cap this cycle
— Davinci Jeremie (@Davincij15) October 17, 2024
Currently, the market capitalization of meme coins has surged to $58 billion, although still behind other up-and-coming crypto sectors such as AI-based tokens and real-world asset cryptos, but still a solid amount nonetheless.
On the bullish side, investors would have a pretty good chance of significant profits upon its break from resistance levels into $0.000028, with the current momentum at their side, there is hope that the rest of the meme coins might also witness good performance, too.
The Current Status Of Meme Coins
It might have ended its global trend reversal and gone off a prior downtrend but do not count it out yet since during the late parts of September 2024, SHIB saw a huge spike as it recorded an all-time high at $0.00002135.
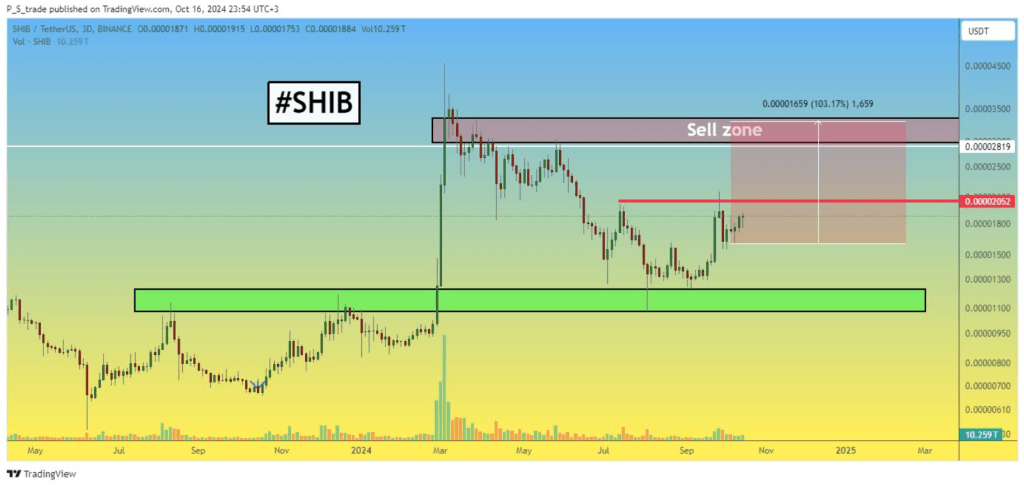
This peak successfully broke two strong resistance levels which can only mean good for the coin and other meme coins. From the technical analysis from PS Trade, there is a high resistance point that is at $0.00002052 where around 83.75 trillion tokens are kept at this price level.
$SHIB
Although the price of #SHIBUSDT is still not rising very confidently on the 3-day timeframe, the global downward trend reversal structure is complete. Therefore, our target for this cryptocurrency is 100% growth. pic.twitter.com/DhOcxx3j1T— PS trade (@PStrade2) October 16, 2024

PS Trade said the global downward trend reversal structure is complete even if the price of SHIBUSDT is still not increasing very strongly on the three-day period. For this coin, he said their aim is therefore 100% increase.
It was found that by the end of September, a double local top had been formed in two successive days above its high made in the middle of July. However, the strongest resistance band lies between $0.000018 and $0.000020 since 439.16 trillion tokens are dispersed across 45,620 wallets. If the bullish trend of SHIB continues, then it might test the next major hurdle at $0.000028.

Related Reading
Shiba Inu: Technical Indicators And Market Challenges
Large-position institutional investors pushed SHIB back below $0.000018. As the CMF is still negative at – 0.22, this presents selling pressure from the large holders. Meanwhile, the StochRSI has revealed that SHIB was already entering into an overbought position due to its values oscillating between 71 and 57.
That makes it important that the oscillators and charts begin to show signs of short-term volatility and further corrections if the selling pressure continues. However, given the strong bullish setup, a further rally is quite possible. Investors need to keep an eye on key resistance levels as well as technical indicators for further movements in SHIB.
Featured image from CNBC, chart from TradingView
Credit: Source link


