Join Our Telegram channel to stay up to date on breaking news coverage
The ApeCoin price prediction reveals that APE is moving bullishly with a gain of 3.88%, as the coin prepares for a bullish cross.
ApeCoin Prediction Statistics Data:
- ApeCoin price now – $1.97
- ApeCoin market cap – $718 million
- ApeCoin circulating supply – 368.5 million
- ApeCoin total supply – 1 billion
- ApeCoin Coinmarketcap ranking – #55
APE/USD Market
Key Levels:
Resistance levels: $3.00, $3.20, $3.40
Support levels: $1.00, $0.80, $0.60
APE/USD is seen trading in the green at the time of writing as the coin gets ready to cross above the upper boundary of the channel with a gain of 3.88%. According to the daily chart, the candle formation is currently following the upward movement but staying below the 9-day and 21-day moving averages might position the market price toward the south, and the closest support level is located around the $1.97 level.
ApeCoin Price Prediction: ApeCoin Price May Spike to the Upside
The ApeCoin price is currently heading toward the 9-day and 21-day moving averages. However, an increase above the upper boundary of the channel could trigger intense buying to the resistance levels of $3.00, $3.20, and $3.40 respectively. On the contrary, the ApeCoin price may likely hold a support level at $1.90 which could be the daily low. Therefore, if the ApeCoin price drops below this support level, it may likely hit the closest support at $1.70.
Meanwhile, the critical supports could be located around $1.00, $0.80, and $0.60 if the selling volume keeps increasing. Nevertheless, the technical indicator Relative Strength Index (14) reveals that the market may gain more upwards if the signal line crosses above the 40-level.
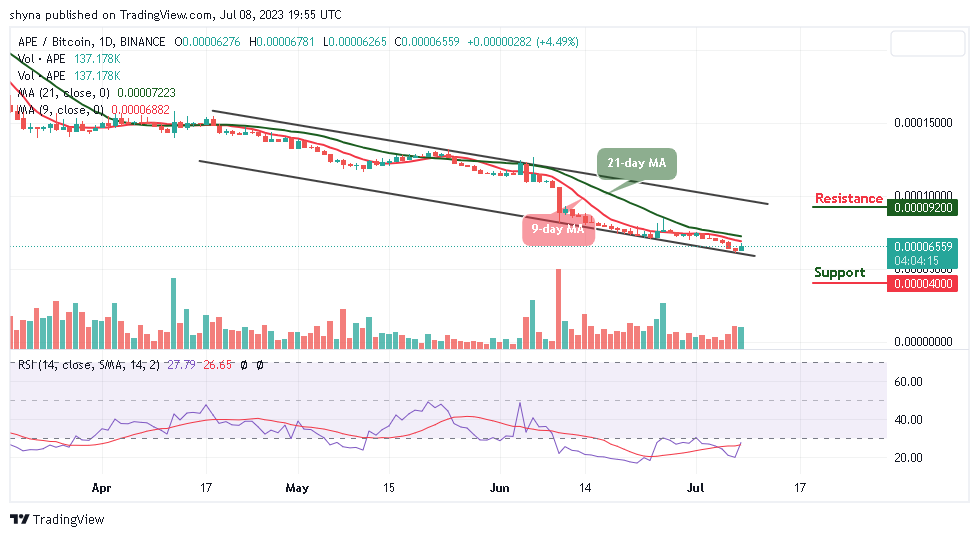
Against Bitcoin, the ApeCoin buyers are likely to push the coin above the 9-day and 21-day moving averages. Meanwhile, from the upside, the nearest level of resistance lies above the upper boundary of the channel at 9200 SAT and above as the technical indicator Relative Strength Index (14) moves to cross above the 30-level.

Looking at the downside; the nearest level of support is 6000 SAT, if the price drops further to create a new low, lower support could be found at 4000 SAT and below. Furthermore, if the 9-day MA crosses above the 21-day MA, this could be a confirmation that the market may follow the upward movement.
Alternatives to ApeCoin
According to the daily chart, APE/USD is running a little retracement move toward $2.0 with a price growth of 3.88%. For the fact that the coin is recording a slight gain, the ApeCoin price may begin to maintain a bullish movement within the channel if the coin can cross above the 9-day and 21-day moving averages.
Nevertheless, following its presale launch in late May, Wall Street Memes quickly caught the attention of crypto enthusiasts worldwide, leading to the project recently breaching the $12.5m milestone. With an established community and an endearing legacy, Wall Street Memes seeks to leverage the current meme coin craze to its advantage as the token has raised close to $13m in the presale.
Wall Street Memes – Next Big Crypto
- Early Access Presale Live Now
- Established Community of Stocks & Crypto Traders
- Featured on BeInCrypto, Bitcoinist, Yahoo Finance
- Rated Best Crypto to Buy Now In Meme Coin Sector
- Team Behind OpenSea NFT Collection – Wall St Bulls
- Tweets Replied to by Elon Musk
Join Our Telegram channel to stay up to date on breaking news coverage
Credit: Source link


