Bitcoin has now broken the $31,000 mark with its latest rally. According to on-chain data, the level could be the next major milestone for BTC.
Bitcoin Realized Price Of 2021 Holders Is $35,000 At The Moment
In a new post on X, analyst James V. Straten has discussed the profit/loss situation of the different yearly Bitcoin buyer cohorts. The indicator of interest here is the “realized price,” which keeps track of the average price at which investors in the BTC market bought their coins.
When the asset’s spot price is below this metric, the average holder in the sector is at a loss right now. On the other hand, it being above the indicator suggests the dominance of profits among the investors.
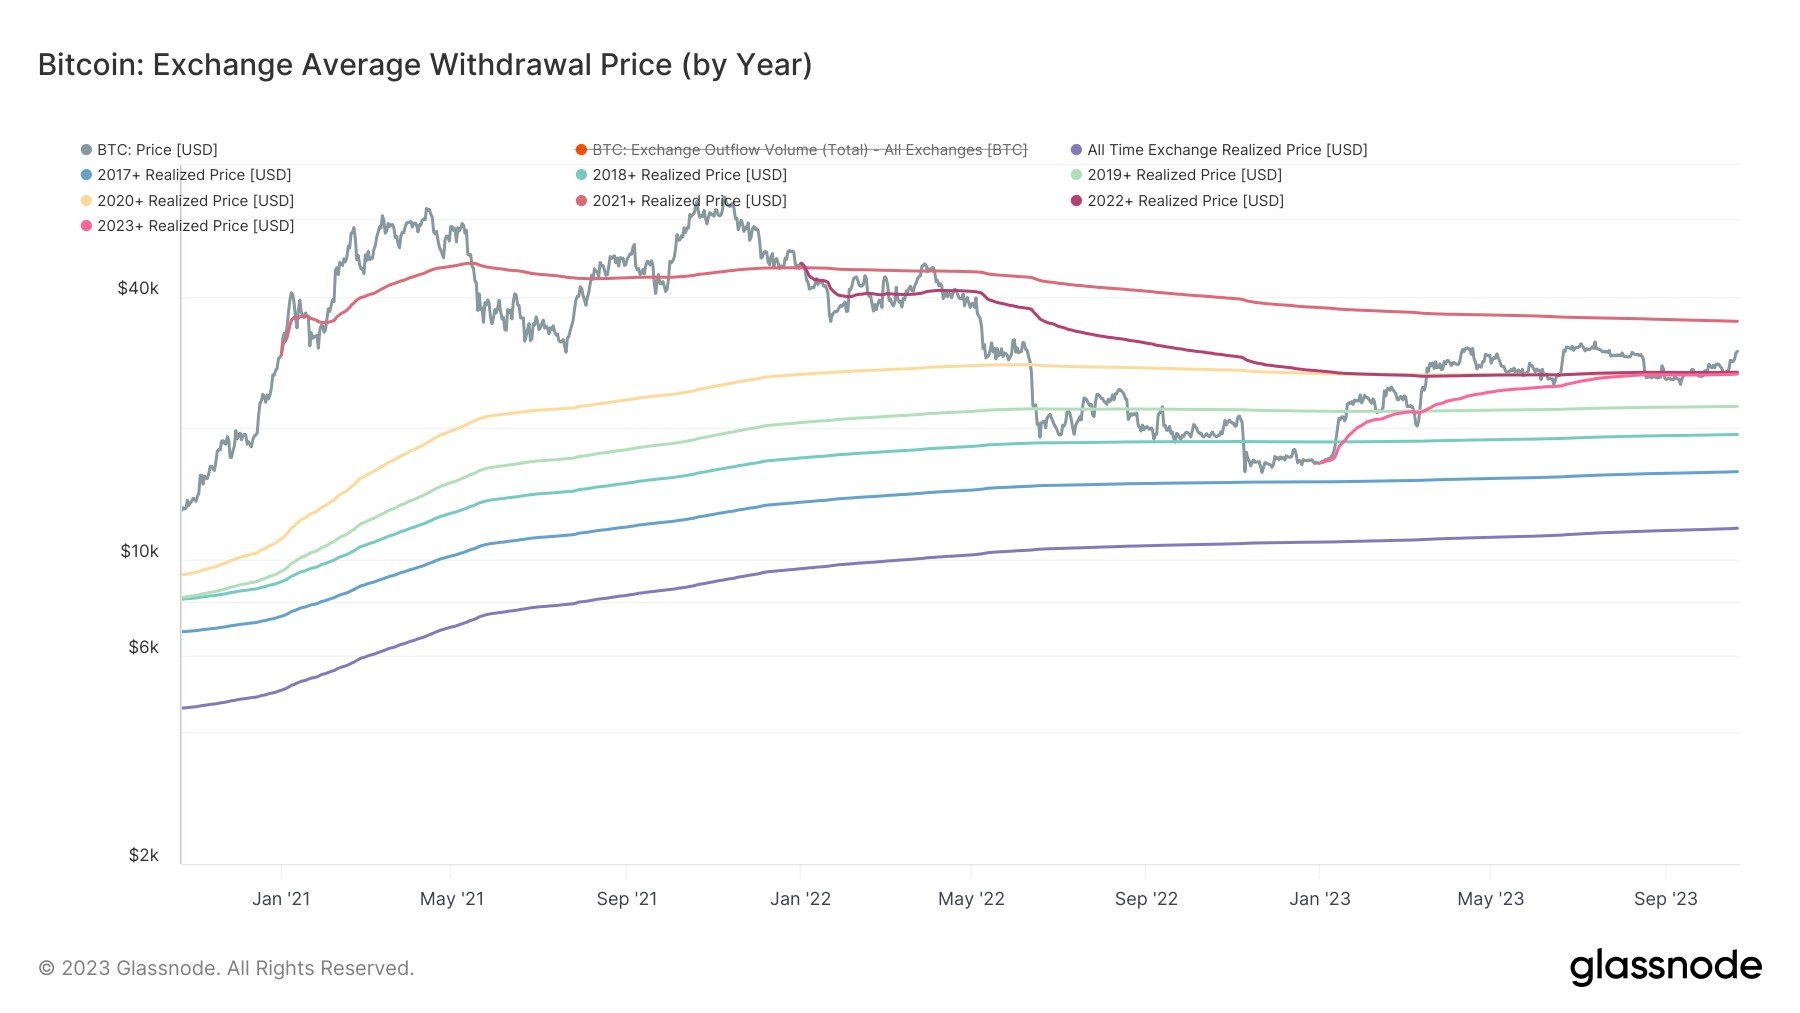
Here, Straten hasn’t shared the chart for the ordinary realized price for the entire circulating supply but rather a few versions of the metric that only consider buyers since the start of a particular year. The chart below shows the trend in the Bitcoin realized price for each year since 2017.
The data for the different realized price levels | Source: @jimmyvs24 on X
As is visible in the graph, the Bitcoin realized price for all years except 2021 is below the current spot price of the cryptocurrency. This implies that the different yearly cohorts of the asset are holding their coins at some net unrealized profit.
The latest groups to enter into a state of profit have been the 2022+ and 2023+ ones. The 2021+ group has a realized price of about $35,000 at the moment, which is still a significant distance away, but as Straten has noted, the gap between the spot price and the metric is now the narrowest since the two diverged back at the start of the bear market.
Interestingly, during the peak in 2021, this group’s cost basis was around $48,000. The analyst suggests their realized price, since decreasing significantly, indicates some impressive Dollar-Cost Averaging (DCA) in the market.
In on-chain analysis, major cost basis levels have always played an important role, as the BTC spot price has often observed support or resistance on retests of them.
The chart shows that the Bitcoin price had found support at the 2023+ realized price back in June. The recent seemingly endless consolidation that BTC saw before the latest rally happened around the 2022+ and 2023+ metrics after they had overlapped.
Given the historical examples, the 2021+ may realize price will cause the price to react somehow when it eventually reaches there. Thus, the $35,000 level would be a significant milestone for the asset, as successfully claiming it could imply clear waters ahead for the cryptocurrency.
At the same time, however, the chances of participants buckling and harvesting their gains are increasing with all these groups coming into profits. Such profit-taking can lead to a pullback in the price, at least in the short term.
BTC Price
At the time of writing, Bitcoin is trading at around $31,200, up 11% in the past week.
Looks like BTC has enjoyed some sharp upwards momentum in the last few days | Source: BTCUSD on TradingView
Featured image from Kanchanara on Unsplash.com, charts from TradingView.com, Glassnode.com
Credit: Source link


