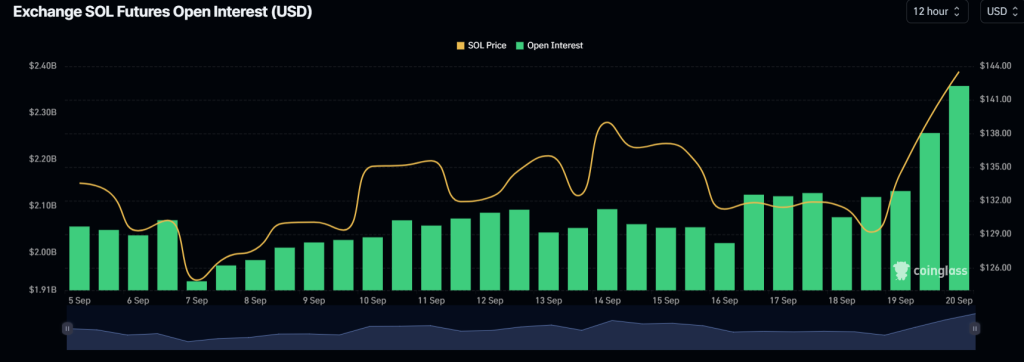
On September 20, 2024, Solana (SOL), the sixth biggest cryptocurrency by market cap is poised for significant rally potential due to its bullish breakout and on-chain metrics. After struggling for almost three weeks, SOL has breached its consolidation zone and is now again heading toward the $165 level.
Solana Price Momentum
At press time, SOL is trading near $144 and has experienced a price surge of over 10% over the past 24 hours. During the same period, its trading volume increased by 31%, indicating higher participation from crypto enthusiasts amid the recent breakout.
Solana Technical Analysis and Upcoming Levels
According to expert technical analysis, SOL appears bullish and is in an uptrend as it is currently trading above the 200 Exponential Moving Average (EMA) on a daily time frame. The 200 EMA is a technical indicator that investors and traders use to determine whether an asset is in an uptrend or downtrend.
As of now, this breakout isn’t considered successful until SOL price closes its daily candle above the $141.5 level. If this happens, there is a strong possibility it could soar by 15% to its resistance level of $165 in the coming days.
SOL’s Bullish On-chain Metrics
Besides this breakout, SOL’s on-chain metrics such as long/short ratio, future open interest, and OI-weighted fund rate are also flashing bullish signals. Coinglass’s Long/Short ratio currently stands at 1.02 (a value above 1 indicates bullish market sentiment). Meanwhile, its future open interest has increased by 13% in the last 24 hours and has been steadily rising.

This rising open interest signals that bulls are betting more on long positions compared to short positions. As of now, 51% of top traders hold long positions, while 49% hold short positions. These data indicate that bulls are back in the market and currently dominating the asset.
Typically, traders and investors use the combination of rising open interest and long/short ratio above 1 to build up their long or short positions.
Credit: Source link


