With Bitcoin crossing above $91,000, the rising risk appetite of crypto investors teases a bull run in altcoins. Amid the increasing demand, many have hit a new 52-week high with the reversal rally gaining momentum.
Will the increasing bullish momentum in altcoins result in a new all-time high for a few altcoins? Are you wondering the same? Worry not. We bring a list of the top three altcoins of high potential to reach new all-time high levels in the coming week.
So, let’s take a closer look at the price action analysis of these potential altcoins.
Top Altcoins With a New All-time High Potential:
Jupiter (JUP)
With a market cap of $1.5 billion, the Jupiter token is currently trading at $1.13. Over the past 24 hours, the altcoin has increased by 5.25% and is currently at a discount of 45% from its all-time high level of $2.04.
Tradingview
Over the last 30 days, it has increased by 35%, revealing a bullish trend in action. In the daily chart, the Jupiter price action shows a triangle breakout rally gaining momentum. This has led to a higher high formation in the daily price trend and a reclamation of the 50% Fibonacci level at the $1.00 psychological mark.
The bullish surge has resulted in a positive crossover between the 50-day and 200-day SMA line. This marks a golden crossover and increases the uptrend continuation chances.
Currently, with a bullish engulfing candle, the JUP price action shows a poor status reversal from the $1.00 mark. Further, the bull run is struggling to reduce the 61.8% Fibonacci level at $1.20.
However, as a rising DEX over the Solana network, Jupiter shows massive momentum. The Fibonacci levels being the upside target at $2.26 and $3.16 at $1.272 and $1.618 levels.
Will the Jupiter (JUP) price cross $5? Find out now in the latest JUP price prediction by Coinpedia.
Pendle (PENDLE)
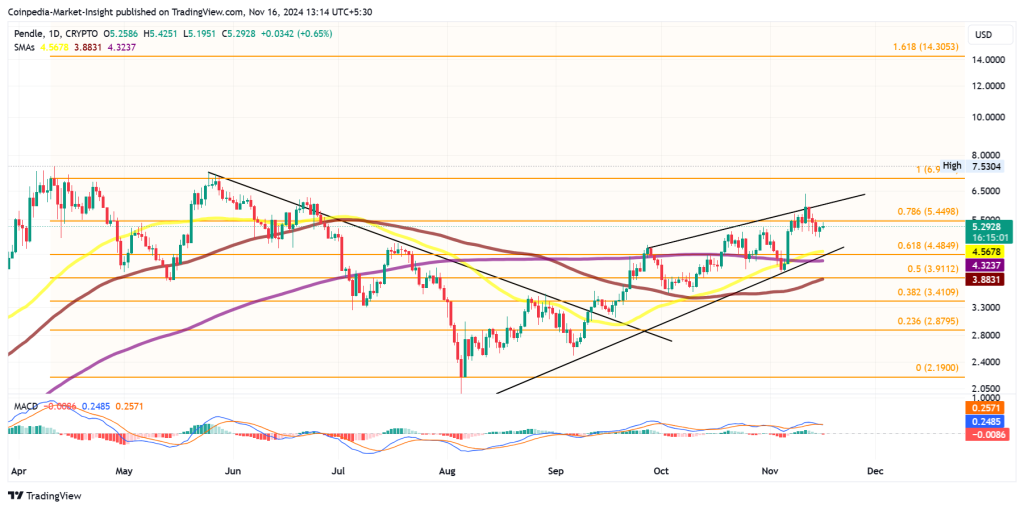
In the market cap of $867 million, the PENDLE token PENDLE token is trading at $5.30. Over the last 30 days, it has increased by 26.80% and is trading at a 30% discount from its all-time high level of $7.5171.

Tradingview
In the daily chart, the PENDLE price action reveals Triangle Breakout Rally ends in closer to a new all-time high level. Despite facing resistance from a short-term overhead resistance trend line, the bullish trend forms a rising wedge pattern.
With a 2.28% jump last night, the bullish trend is now challenging the 78.60% Fibonacci level at $5.4498. A bullish breakout of the overhead resistance trend line will likely result in a high-momentum rally crossing above the current all-time high level.
Supporting the bull run chances, the golden crossover in the SMA lines marks a dynamic shift in the underlying sentiments. Based on the Fibonacci levels, the upside target for a bullish continuation above the current high level is $9.57 and $14.30.
Jito Finance (JTO)
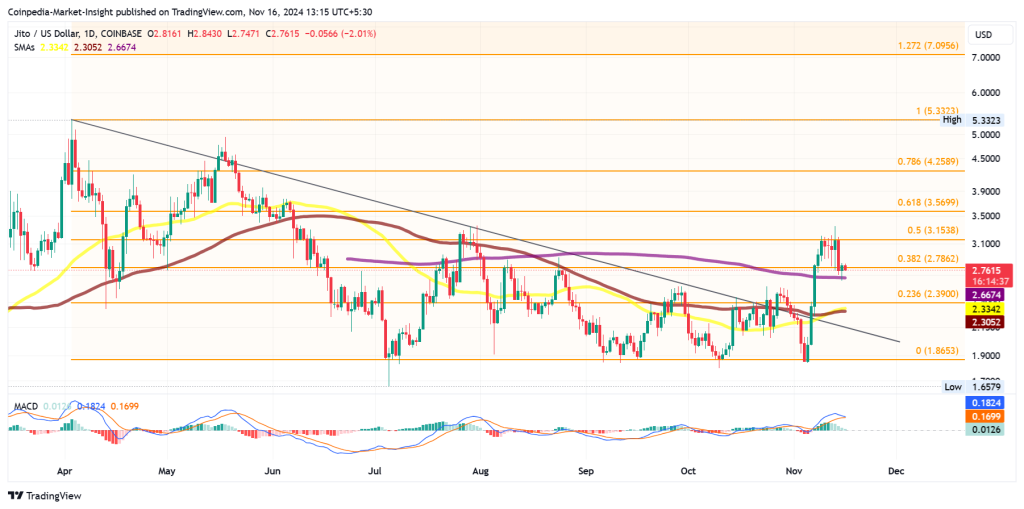
Currently, it is trading at a discount of 47.69% from its all-time high level of $5.28. Since the all-time high formation, the bullish failure to end the lower-high trend formation led to a resistance trendline.

Tradingview
The recent reversal from the $1.86 mark has resulted in a breakout rally, reaching the 50% Fibonacci level at $3.15. However, the DeFi token now retests the 38.20% Fibonacci level and the 200-day SMA line with a quick reversal.
As the 50-day and 100-day SMA line give a positive crossover, the chances of a post-retest reversal for JTO token have significantly increased. Considering the trend-based Fibonacci levels, a new all-time high in JTO finance will find the price target at $7.00 and $10.20. These price targets are derived from the 1.272 and 1.618 Fibonacci levels.
FAQs
The 78.6% Fibonacci level at $5.4498 is a critical resistance, with a breakout potentially leading to new highs.
Fibonacci targets suggest JTO could reach $7.00 (1.272 level) and $10.20 (1.618 level) after a post-retest rally.
What are the key technical levels for Jupiter (JUP)?
The $1.00 psychological mark (50% Fibonacci) acts as support, while resistance lies at $1.20 (61.8% Fibonacci level).
Credit: Source link


