Bitcoin deep dive: 15M BTC in self-custody as Binance withdrawals peak, derivatives switch to ‘risk-off’
Risk is off the table
Risk, leverage, and speculation could be considered the keywords for 2021 as excess cash from covid stimulus entered the stock market and crypto ecosystem. Many traditional financial assets have since returned to their pre-covid levels, such as Ark Innovation ETF, public equities such as Coinbase, and Bitcoin mining stocks making all-time lows. However, Bitcoin is still up around 5x from its covid lows.

The introduction of derivatives was a big part of the 2021 bull run, which allowed investors to take on additional risk, and speculation. One avenue is futures open interest, the total amount of funds (USD Value) allocated in open futures contracts.
The 2021 bull run saw 72% of all collateral used for futures open interest was crypto margin, i.e., BTC. As the underlying asset is volatile, this would add further volatility and risk to leveraged position.
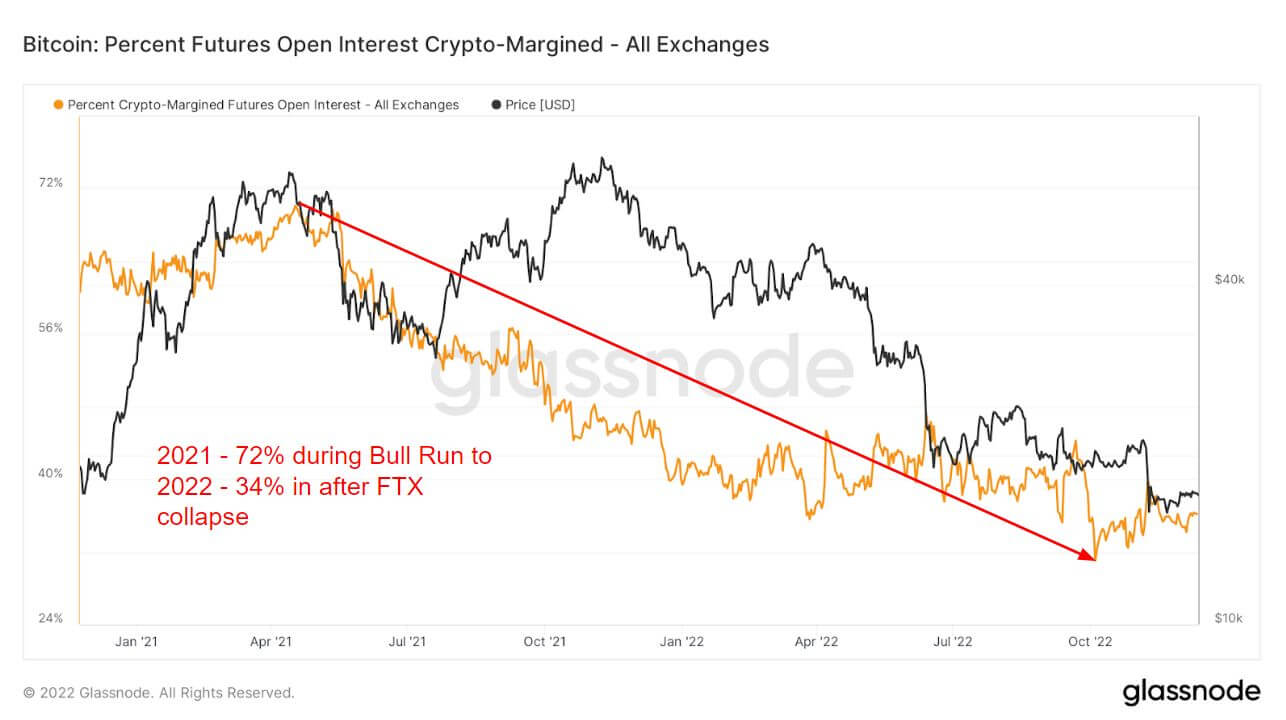
However, as 2022 approached and risk collapsed, investors used as little as 34% of the margin in crypto. Instead, they moved to either fiat or stablecoin to hedge against the volatility, as either instrument is not volatile by nature. Crypto margin has been less than 40% since the Luna collapse, which indicates risk-off and has stayed flat for the remainder of 2022.
Drastic divergence in futures between 2021 and 2022
The perpetual swap funding rates during 2021 were mainly investors going long and indicated investors were increasingly bullish on BTC. However, funding rates in 2022 have been somewhat muted compared to 2021.
The average funding rate (in %) set by exchanges for perpetual futures contracts. When the rate is positive, long positions periodically pay short positions. Conversely, when the rate is negative, short positions periodically pay long positions.
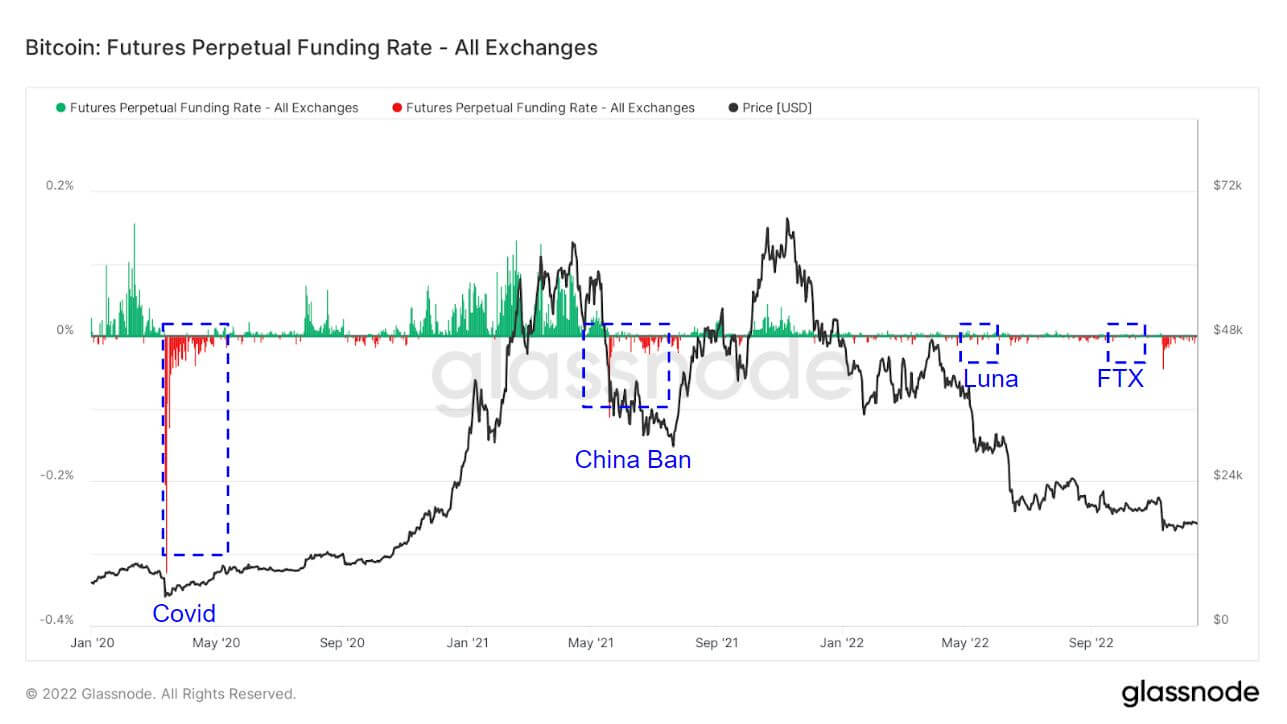
Highlighted are areas when investors take the opposite direction and short the market. It just so happens it coincided with black swan events. Covid, China banning BTC, Luna, and the FTX collapse saw a huge shorts premium. This is usually a low in the cycle for BTC or a local bottom as investors try to send BTC as low as possible.
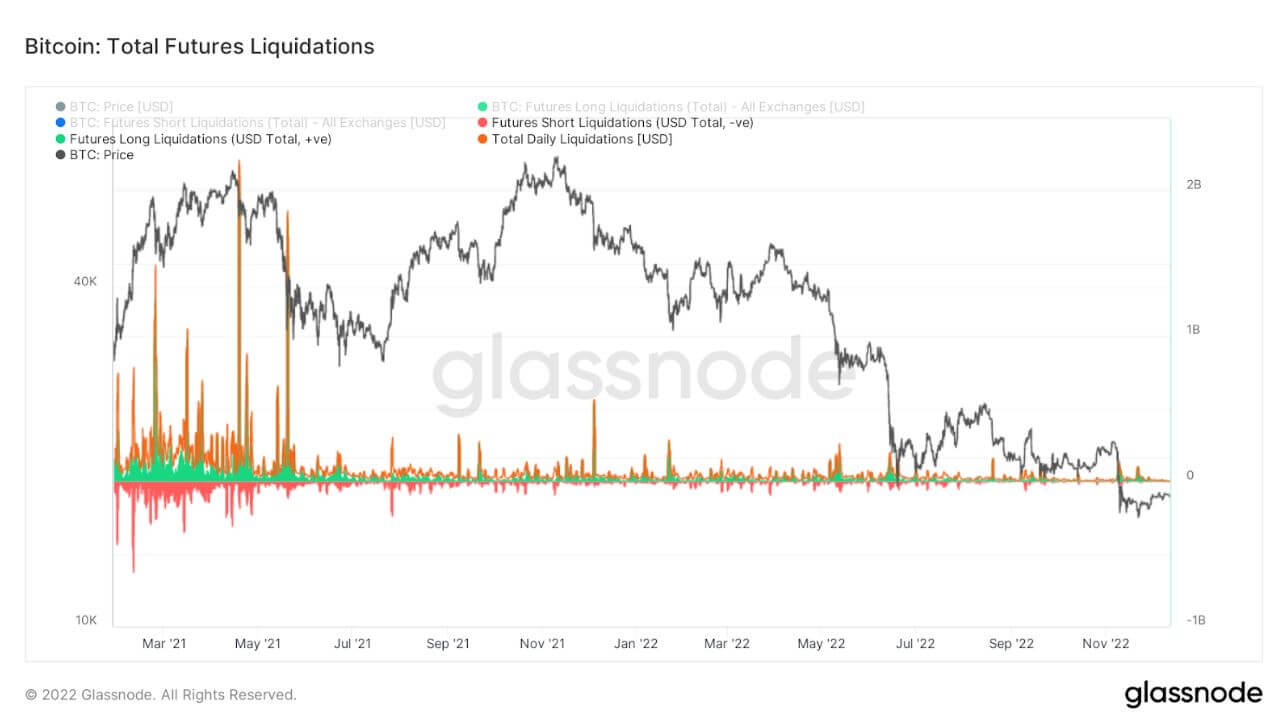
As a result of less leverage in the market, liquidations in 2022 have been muted compared to 2021, where investors were being liquidated billions of dollars in early 2021; 2022 is now just millions.
Retail taking self-custody
Illiquid supply just passed through 15 million coins held in cold or hot storage wallets. As the circulating supply of BTC is around 19.2 million, this would make up 78% of all coins in the circulating supply held by illiquid entities.
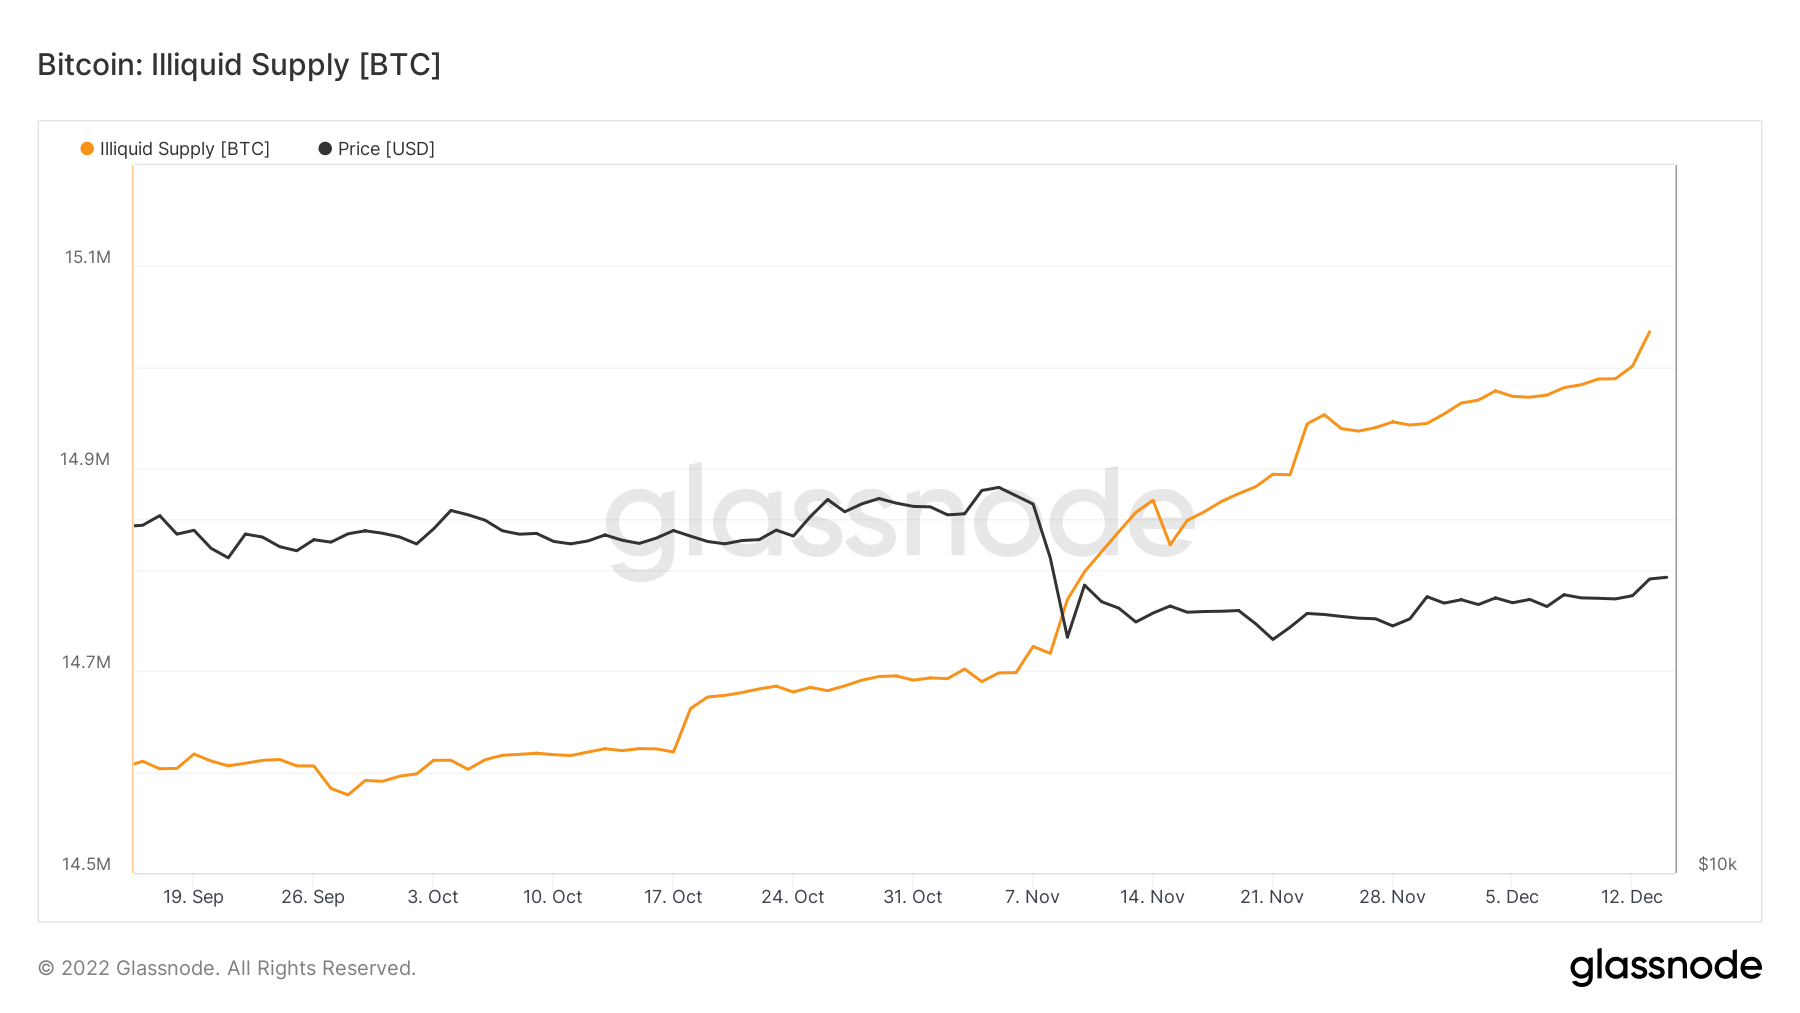
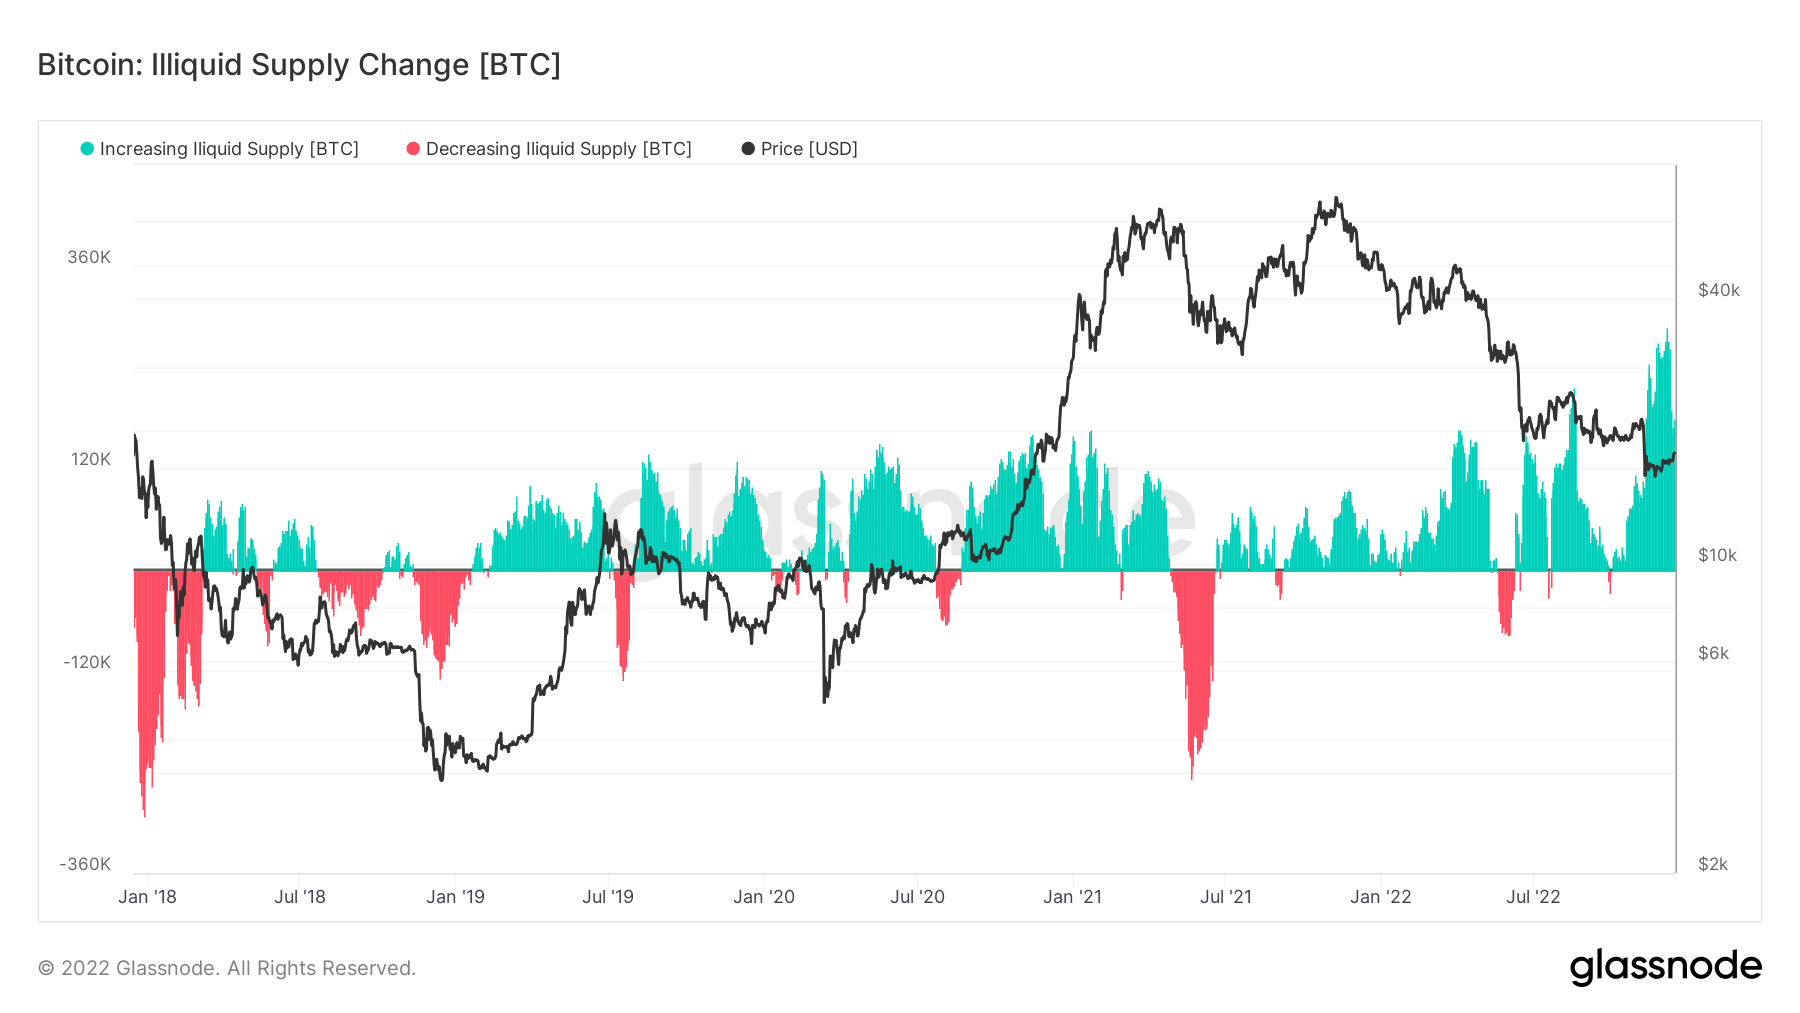
Self-custody has been a central focus due to the collapse of FTX, and in the past three months, the rate of change of illiquid supply has been the highest for over five years, showing that coins are leaving exchanges.
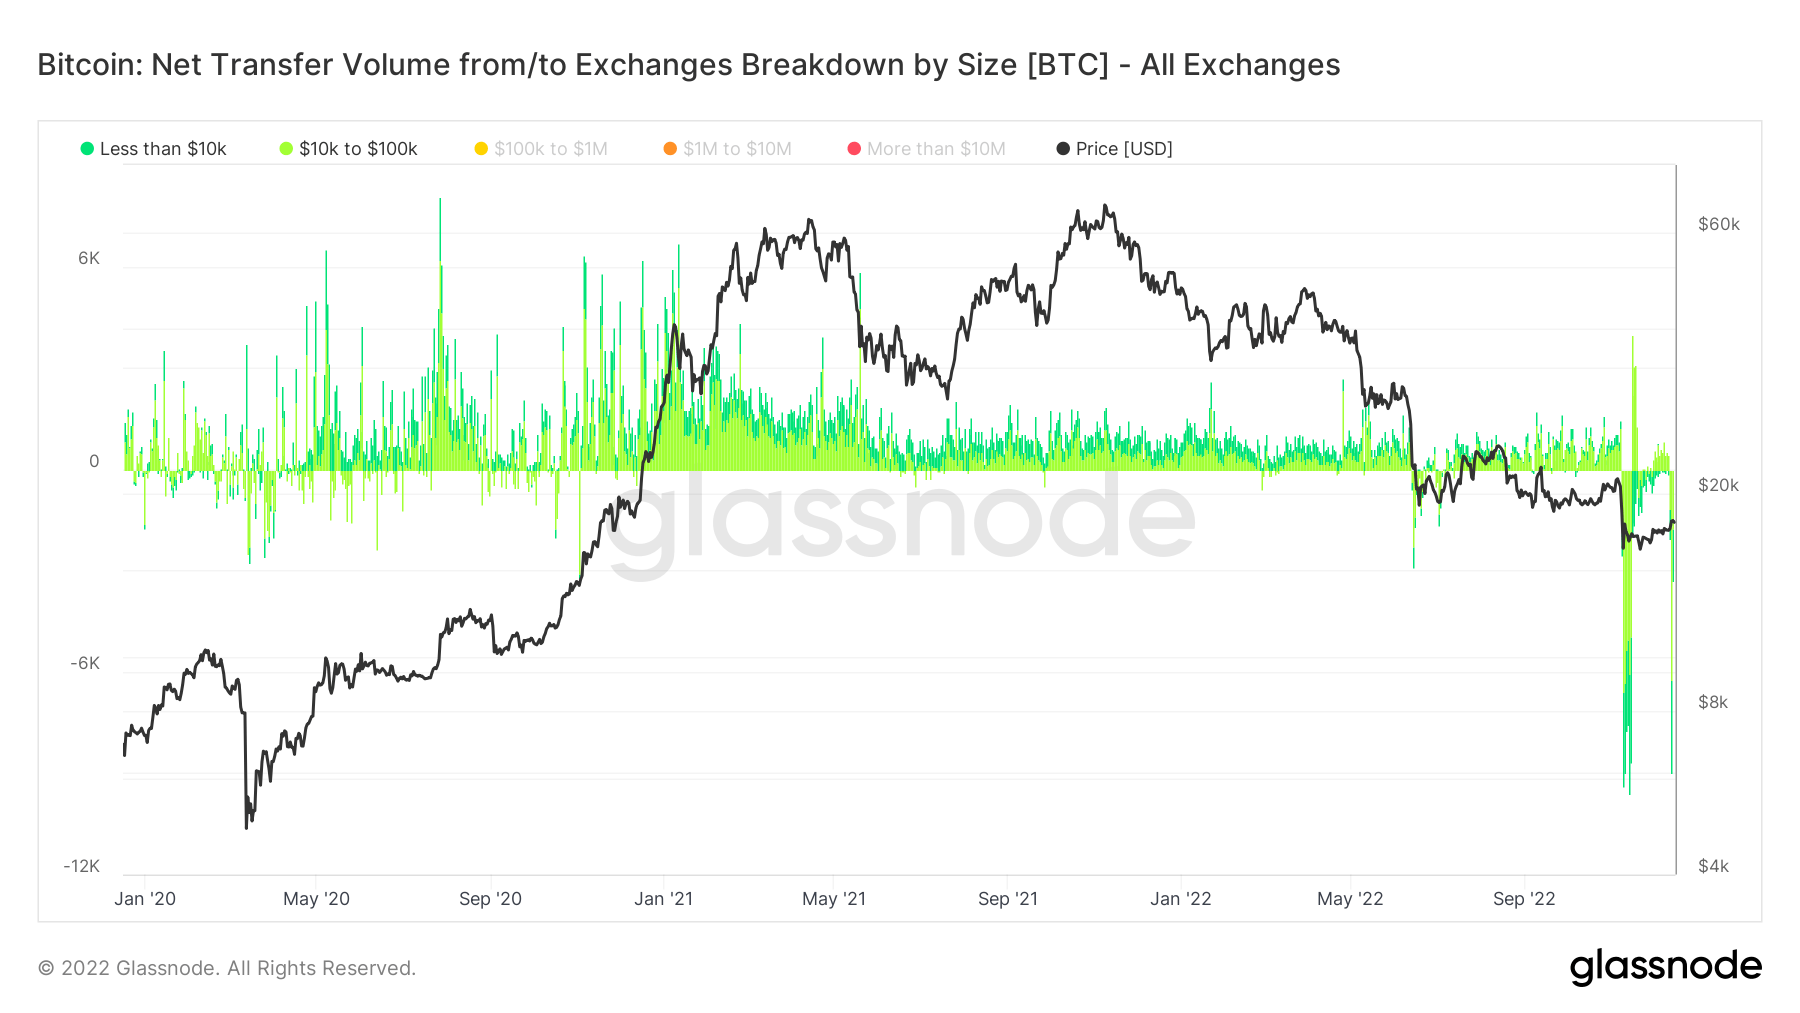
Understanding the investors taking their coins off exchanges is done through the metric, Net Transfer Volume from/to Exchanges Breakdown by Size.
Selecting below $100k insinuates retail transactions, which saw $160m being withdrawn on multiple occasions during the FTX collapse and, most recently, a large number of withdrawals from Binance, the week commencing Dec. 12.
Mass exodus of coins leaving Binance
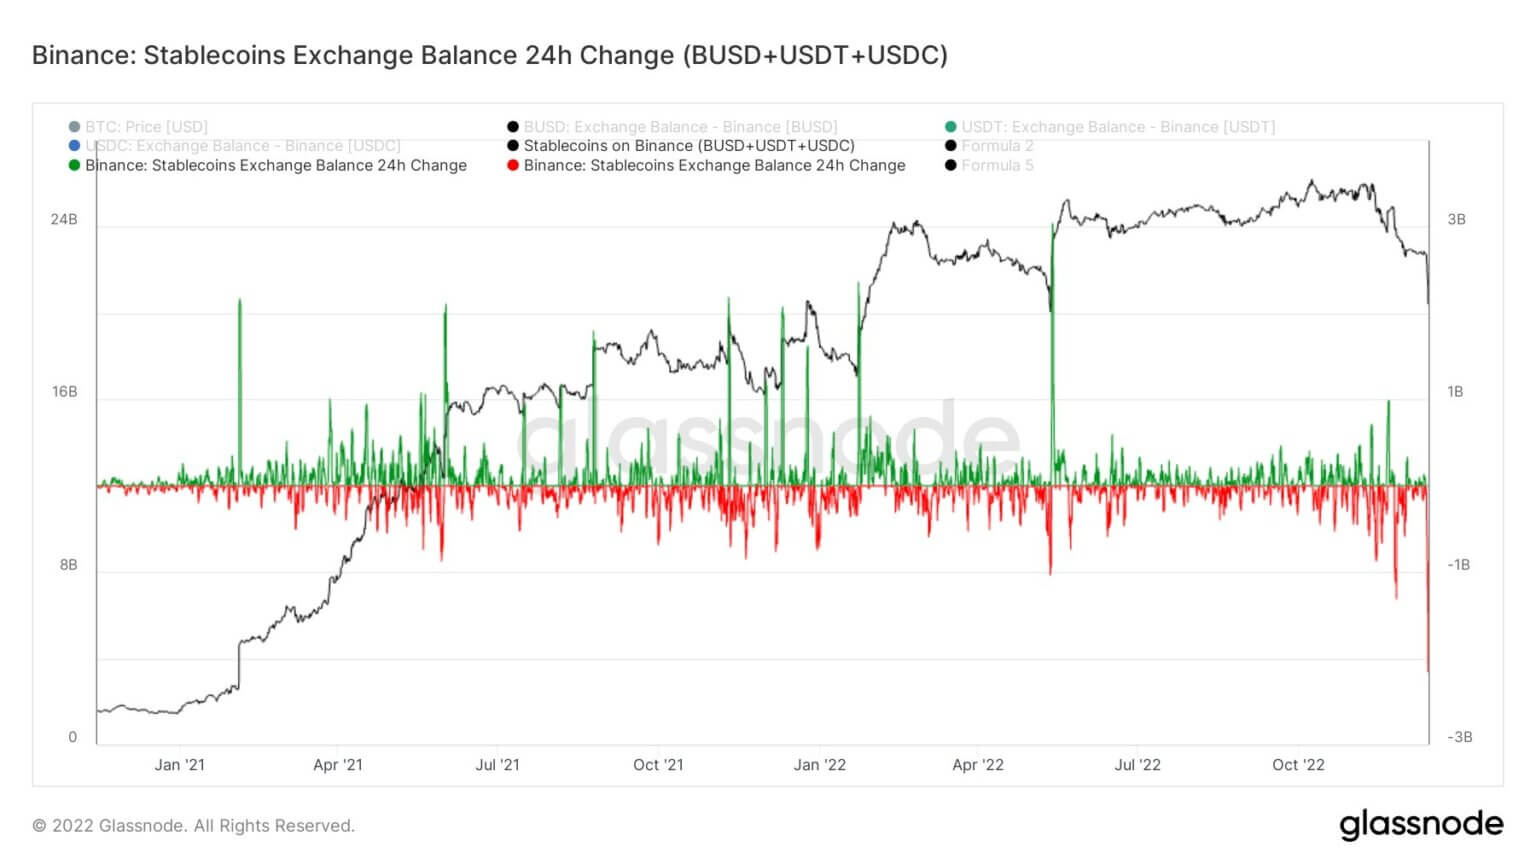
Binance saw unprecedented outflows of coins this week, leaving their exchange. Their proof of reserves fell by $3.5 billion, while Ethereum-based token withdrawals amounted to over $2 billion. However, they managed redemptions and withdrawals seamlessly.
Binance faced the largest stablecoin (BUSD+USDT+USDC) outflows in 24 hours, amounting to $2.159 billion.
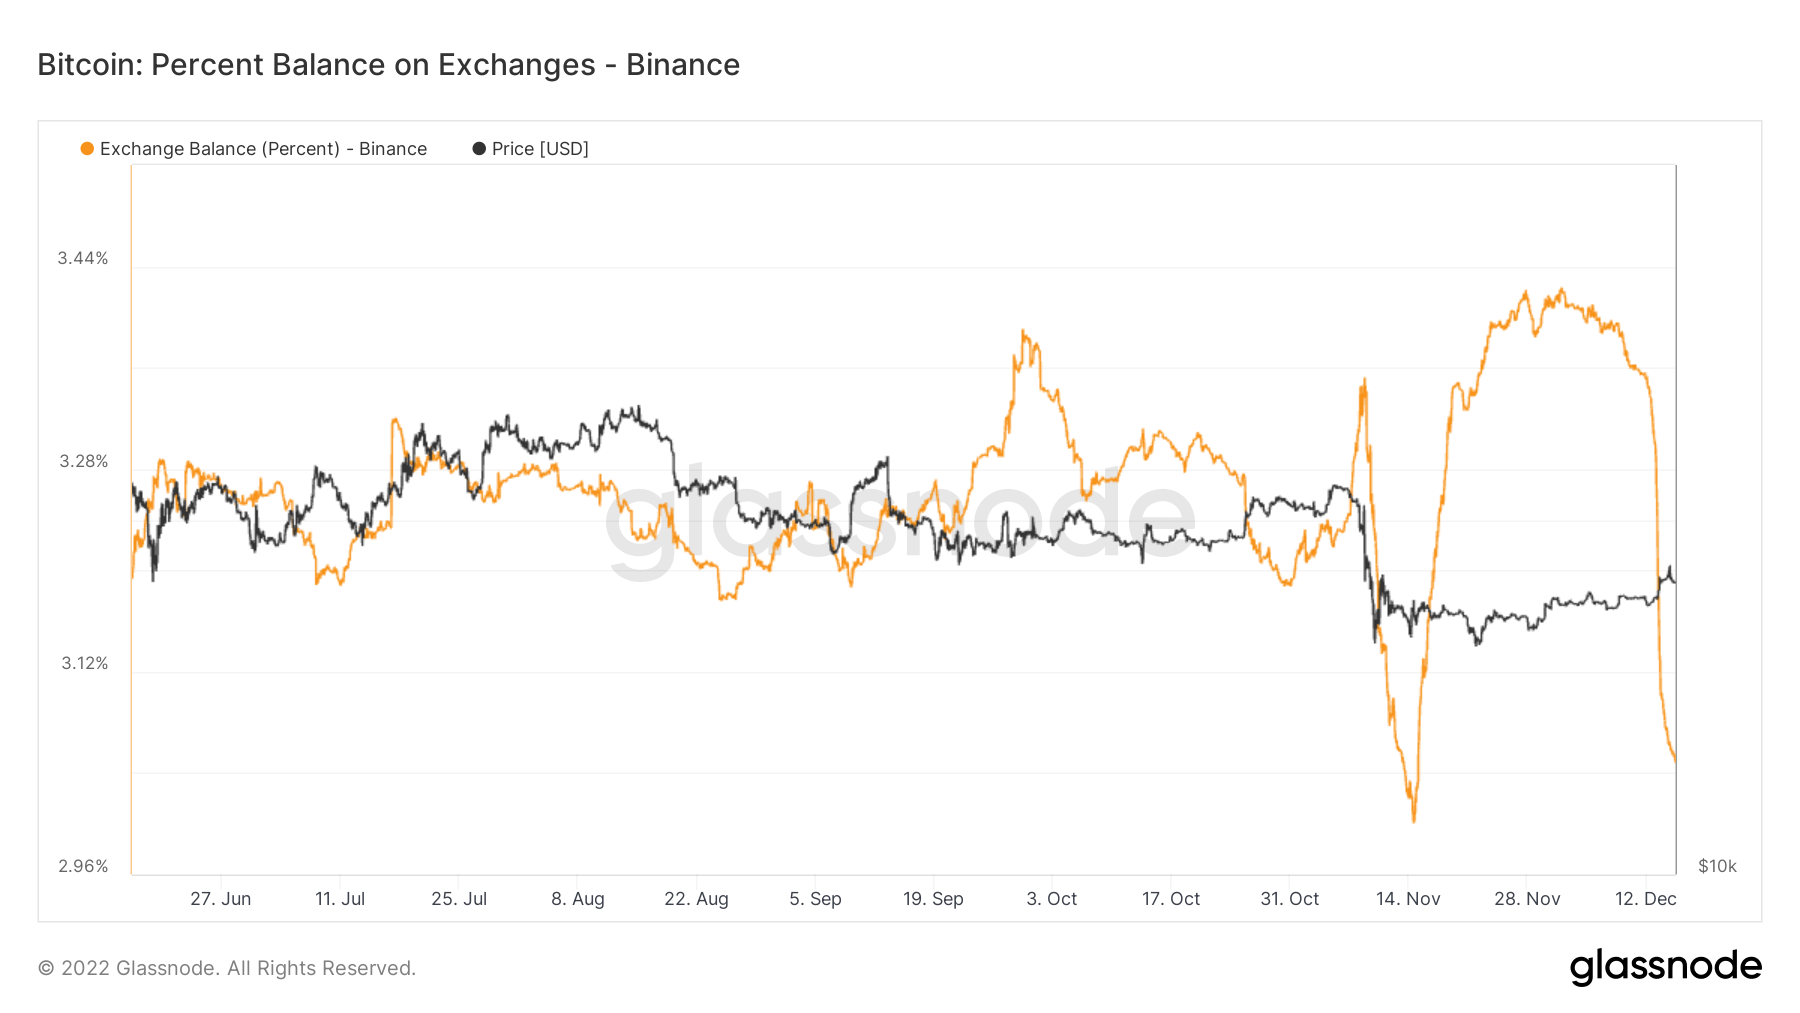
Binance has seen over 65,000 BTC leave their exchange over the past seven days. While its exchange balance depletes, they still hold around 3% of the Bitcoin supply on exchanges – just as the Bitcoin supply on exchanges drops below 12% for the first time since January 2018.
Credit: Source link


