Data shows the Bitcoin open interest has continued to climb recently, a sign that another violent move may be brewing for the asset.
Bitcoin Open Interest Is Steadily Going Up Right Now
In a new post on X, Maartunn, the community manager at CryptoQuant Netherlands, has looked into how the derivative metrics for Bitcoin right now compare against those seen before the recent crash.
There are mainly two indicators of interest here: the open interest and the funding rate. The former measures the total number of BTC positions on the derivative platforms.
When this metric’s value goes up, investors are opening up new market positions. Generally, such a trend leads to higher volatility for the cryptocurrency, as the total leverage in the market also increases with the indicator’s rise.
On the other hand, decreases in the open interest suggest the investors are either closing up their positions or are getting liquidated. Naturally, this could lead to a more stable price for the asset.
Now, here is a chart that shows how the Bitcoin open interest behaved in the leadup to and during the crash from a few days ago:
Looks like the metric had plunged during the crash | Source: Maartunn on X
The chart shows that as the price had declined in the lead-up to the crash, the open interest had increased. When the crash struck, the open interest plunged, as many positions were liquidated. This drawdown in the metric was the sharpest one observed in around 1.5 years.
The heavy liquidations imply that longs had piled up in the market. And indeed, the funding rate, the other metric of relevance here, would confirm this. This indicator tracks the periodic fee traders on derivative exchanges pay each other.
When this metric has a positive value, it means that the long holders are paying the short holders, and hence, the majority of the positions are long ones. As the chart shows, the indicator’s value had been positive during the leadup to the crash.
The situation has changed now, however, as the funding rate has become negative.
The value of the metric has been red recently | Source: Maartunn on X
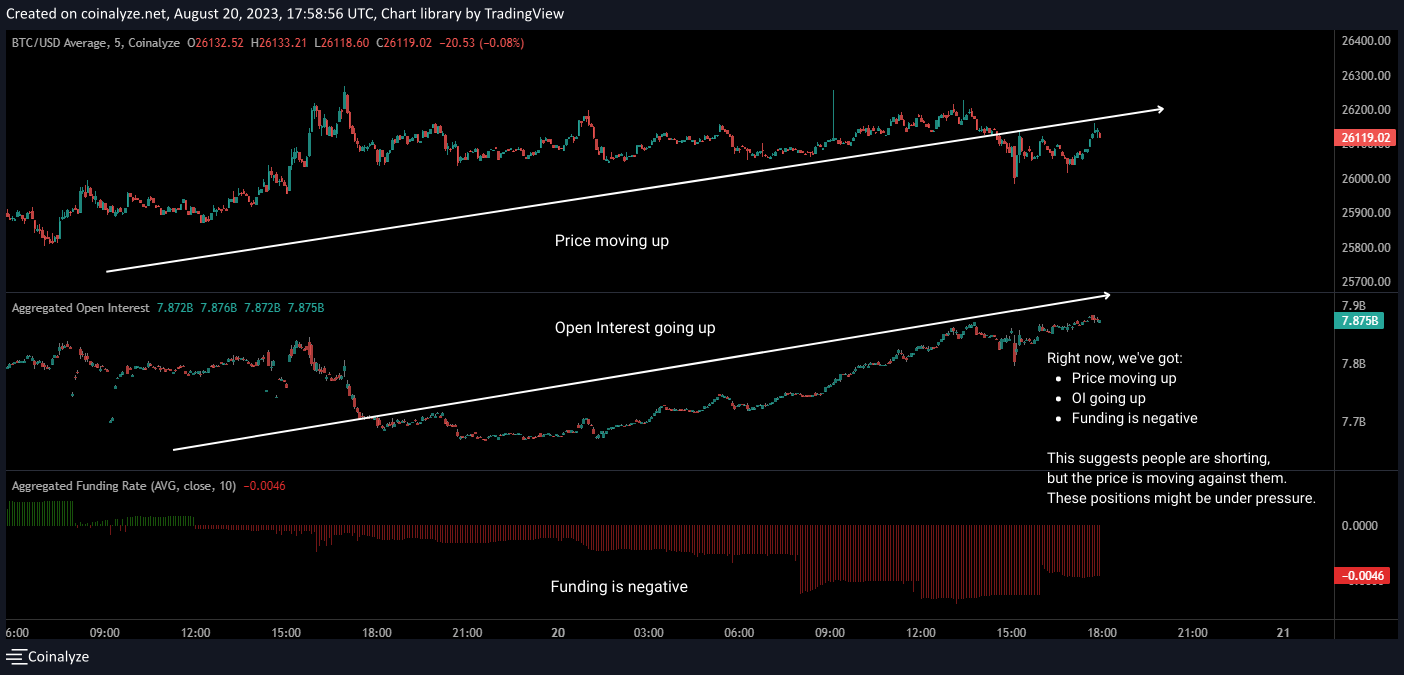
The open interest has been going up in the past couple of days as the price has recovered slightly from its lows. It’s clear, however, that with this rise, the funding rate has only become more negative, a sign that the new positions being opened up are the short ones.
During the crash a few days back, the high open interest fueled the market’s volatility as a violent liquidation event occurred. Since the open interest has once again climbed to relatively high values, it’s possible that a similar event could happen again.
The difference is, of course, that the funding rates are negative this time, implying that the shorts might be the ones that would get caught up in the volatility this time. “Is Bitcoin getting ready for a reverse move from two days ago?” ponders the analyst.
It should be noted, however, that the open interest is currently at notably lesser values than it was right before the crash, so if a move does arise out of the current overheated derivative market conditions, it’s possible that it wouldn’t be as explosive as the crash was.
BTC Price
At the time of writing, Bitcoin is trading around $26,000, down 11% in the last week.
BTC moves sideways around the $26,000 mark | Source: BTCUSD on TradingView
Featured image from Michael Förtsch on Unsplash.com, charts from TradingView.com
Credit: Source link


