After exhibiting a week of bearish consolidations, Bitcoin has again breached the $60K mark, peaking at $61.396. As of press time, BTC traded at $60,520, marking a 3.29% uptick in the last 24 hours.
Following this uptick, the asset’s intraday market cap soared to the $1.194 trillion threshold, solidifying its position as the largest crypto in terms of ranking.

Not to be outdone, BTC’s trading volume follows a similar pattern, spiking by over 31.49% to $28.004 billion in just a single day. This indicates that investors are again portraying robust interest in Bitcoin as it proves its resilience amid market fluctuations.
BTC Whales Seize Opportunity During Consolidation
Despite recent gains, Bitcoin continues to trend sideways, oscillating around the Bollinger Band’s middle arm, implying a phase of consolidation and potential price stability. The relative strength index at 48.67, near the neutral 50 mark, further supports this view of a balanced market with no clear directional momentum.
🐳 Bitcoin’s whales, specifically wallets that hold between 100-1K BTC, have accumulated 94.7K more coins in the last 6 weeks. As price uncertainty has shaken many traders out of crypto, key stakeholders are loading up. pic.twitter.com/hrhlVrNqNU
— Santiment (@santimentfeed) August 19, 2024
In response to these conditions, large holders are taking advantage of the current stability and making tactical moves to capitalize on the market’s consolidation phase. According to Sentiment data, the number of whales holding over 100–1K BTC tokens has accumulated over 94.7K more in the past 6 weeks, strengthening confidence in the asset market.


Similarly, IntoTheBlock’s data shows that BTC witnessed the creation of approximately 294.38K new addresses in a single day, with 702.92K active addresses. This reflects a 6.12% rise in new addresses joining BTC, while active addresses experienced a 1.49% decline over the past week.
Can Bitcoin’s Bull Run Push it to $63K?
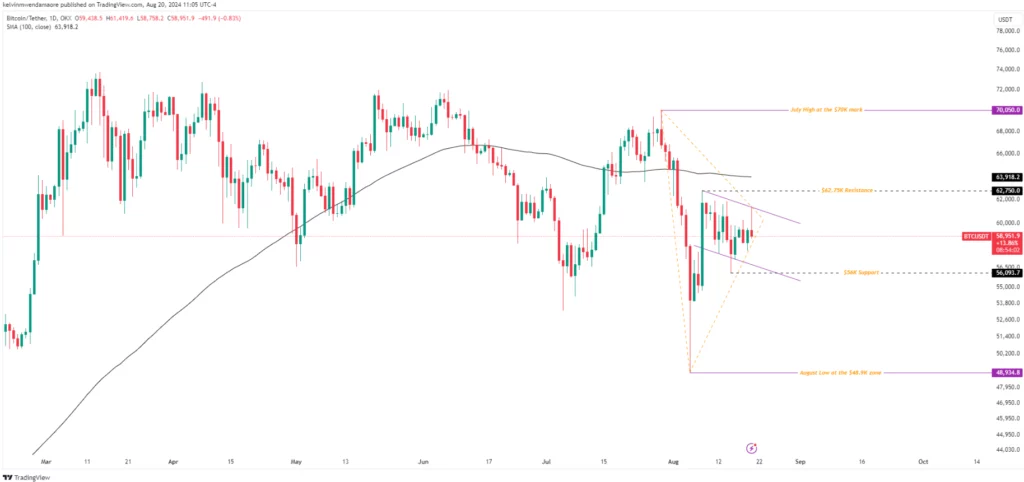
Since August 8, Bitcoin has been oscillating within a bullish flag pattern characterized by a sequence of lower highs and lower lows. This pattern often signals a period of consolidation before a bullish reversal occurs.
In parallel, TradingView’s daily chart shows an ascending triangle forming in the BTC market, reinforcing the potential for a bullish breakout soon. Observing these patterns, market analysts suggest that the bullish momentum may continue, with a possible upward trend in the days ahead.


For traders eyeing potential long positions, Bitcoin presents a viable opportunity as it holds firm above the critical $56,000 level, a threshold established by the August 8 bullish move. The real test, however, lies in a decisive break above $63,000, accompanied by rising volume, which could ignite a surge toward $72,000.
Yet, caution is warranted. Should Bitcoin falter and dip below $56,000, it could spiral into a bearish trend, with a downside target of $50,000.
Also Read: Ethereum Whale Accumulates Toncoin and RCO Finance Priced at $0.034
Credit: Source link


