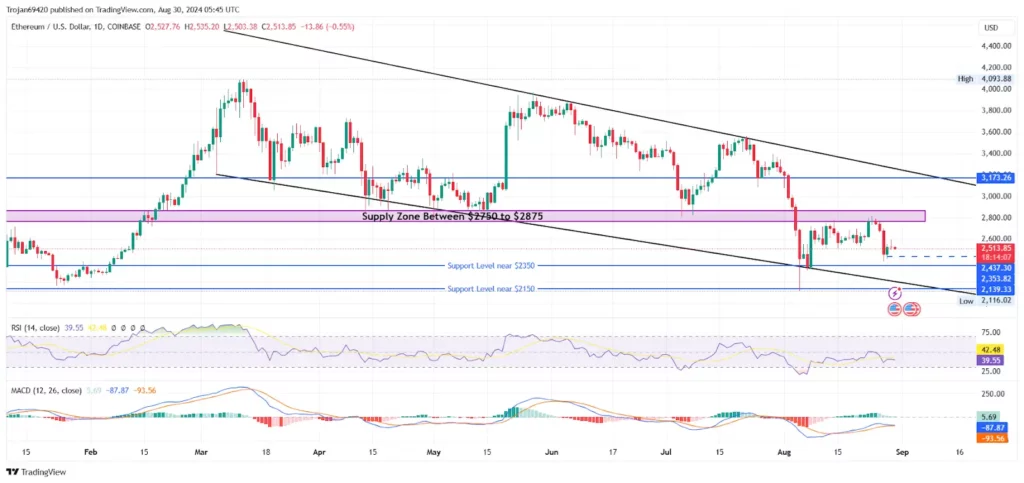
In the daily chart, the Ethereum price action reveals a massive falling channel pattern in motion. Starting from the support trendline near the $2350 support level, the bull cycle struggles to surpass the $2800 supply zone.
Further, the bullish failure to surpass this resistance resulted in a massive three-day crash, accounting for a price drop of 11.22%. However, the 2.86% jump on Wednesday reflects the bullish dominance at the $2400 level.

Source: TradingView
Nevertheless, the Ethereum price struggles to surpass the uptrend above the $2500 psychological mark. With an intraday fall of 0.44%, the pullback is expected to intensify with the higher price rejection witnessed in yesterday’s candle.
The Ethereum price has witnessed a massive correction, accounting for a seven-day price drop of 4.47% and a 30-day drop of 23.98%. However, compared to last year, Ethereum’s price has risen by 48% and has grown by 10.82% year-to-date.
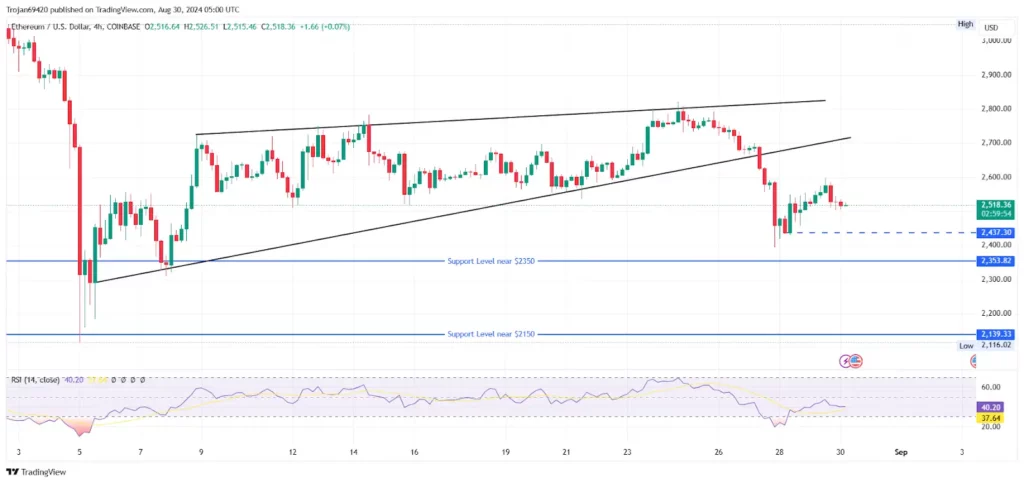
In the 4-hour chart, the bullish failure to surpass the $2800 supply zone reveals a rising wedge breakdown. The rising wedge is formed by two converging trend lines with a narrow path and a narrowing range in a bullish trend.

Source: TradingView
Despite the higher low formation, the asset price struggles to create new highs, resulting in a resistance trend line. The breakdown prolongs the negative cycle with the recent bearish reversal from the overhead trend line.
As a trend continuation pattern, the rising wedge breakdown warns of a bearish trend to the next support levels. The next support levels for Ethereum are $2350 and $2150.
On August 28, the U.S. Ethereum spot ETFs witnessed a miraculous surge in inflows, accounting for $5.8 million. With a positive end to Thursday, the nine-day streak of outflows in Ethereum ETFs ends. The $5.8 million of net inflow includes BlackRock’s (ETHA) $8.4 million and Fidelity’s (FETH) $1.3 million. Stuck in the outflow inertia, Grayscale’s Ethereum Trust (ETHE) accounts for $3.8 million in outflows. However, this registers the lowest outflow since its debut on July 23.
The largest spot Ethereum ETF, Blackrock’s ETHA, gains more than $1 billion in inflows, with FETH and Bitwise Ethereum ETF (ETHW) following with $392.9 million and $314.1 million, respectively. Surprisingly, Grayscale’s Ethereum Mini Trust (ETH) has added inflows worth $235.6 million since its launch.
August 29, on the contrary, witnessed a dull day with no ETH ETF fund movements except Grayscale Trust continuing its outflow streak with a $5.3 million negative flow.
Despite net flows in the Ethereum ETF market hitting the $475.7 million peak, excluding Grayscale’s outflows worth $2.55 billion, Ethereum ETFs have amassed more than $2 billion in inflows.
As the netflows turn positive for a day, the market participants expect the Ethereum sentiment to lift off. However, the price action speaks a different story at the moment.
Will Ethereum be bullish?
Based on the RSI indicator in the daily and 4-hour chart, the bull cycle in Ethereum is facing intense supply pressure. Despite the bounce back from the oversold zone, RSI fails to uphold the trend as the bearish momentum spikes up gradually.
The MACD indicator in the daily chart shows a bearish trend reversal as the average lines are on the cusp of a negative crossover. Thus, the momentum indicators give bearish trends, yet the long-term speculation has bullish Ethereum projections.
With a bullish trend failing to sustain a volatile market, the positive inflows in the Ethereum ETF fail to uplift the sentiments. While a possible double bottom near $2437 seems the final bullish reversal opportunity, a bullish divergence in RSI will be critical.
Until the $2437 support breaks, the stress over the crucial support levels near the $2350 and $2150 remains minimal.
Disclaimer: The analytical piece aims to provide data to investors, with no intention to serve as investment advice. Do your research before planning to invest in the cryptocurrency.
Credit: Source link


