Join Our Telegram channel to stay up to date on breaking news coverage
The Graph price prediction is likely to show an upward trend if the market can rise toward the upper boundary of the channel.
The Graph Prediction Statistics Data:
- The Graph price now – $0.163
- The Graph market cap – is $1.45 billion
- The Graph circulating supply – 8.7 billion
- The Graph total supply – 10.5 billion
- The Graph Coinmarketcap ranking – #40
GRT/USD Market
Key Levels:
Resistance levels: $0.250, $0.270, $0.290
Support levels: $0.100, $0.080, $0.060
According to the daily chart, GRT/USD is showing a positive movement as the coin faces the upside. The market is running a little retracement move towards $0.200 with price growth of 10.48%. Aside from today’s little gain, the Graph price is still maintaining a bullish movement and traders can expect the coin to stay above moving averages for it to gain additional gains.
The Graph Price Prediction: The Graph (GRT) May Consolidate Above the Moving Averages
If the Graph price continues to follow the upward movement, traders can expect a bullish cross above the upper boundary of the channel. However, as the technical indicator, Relative Strength Index (14) moves above the 60-level; the potential resistance levels could be located at $0.250, $0.270, and $0.290 in the long term.
Moreover, if the coin begins to move sideways, the market price may either break above the moving averages or head to the south. Meanwhile, a bearish breakdown may likely play out if the bears step back into the market and this could roll the coin to long-term support at $0.100, $0.080, and $0.060 levels.
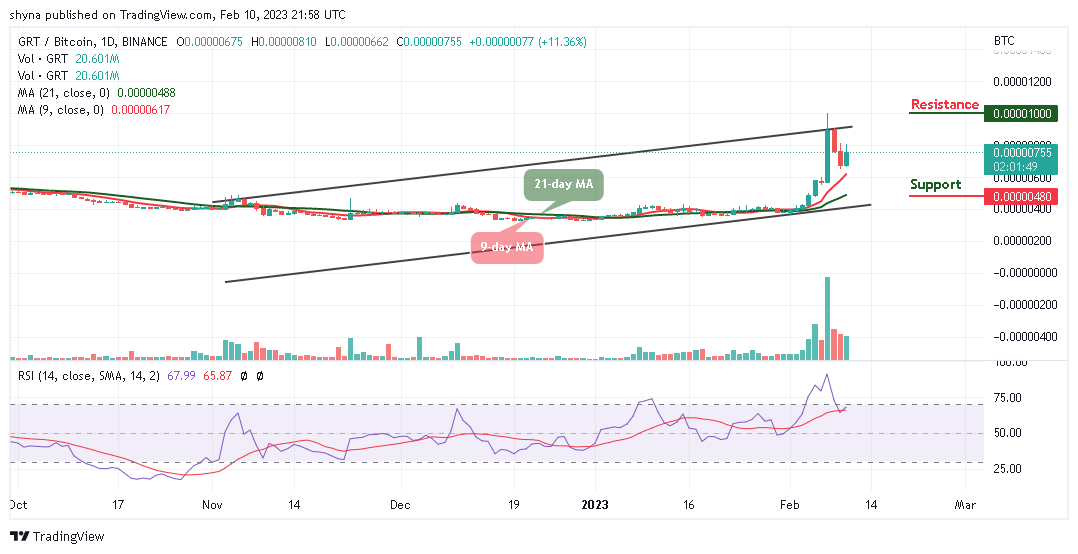
Against Bitcoin, the Graph price is following a bullish sentiment as the coin keeps hovering above the 9-day and 21-day moving averages. However, if the bears attempt to gain momentum, they are likely to keep releasing huge pressure on the market. The technical indicator Relative Strength Index (14) may cross above the 70-level to increase the bullish signals.

However, if the pair slides and head toward the lower boundary of the channel, it could hit the nearest support at 600 SAT. Any further negative movement could lower the price to 480 SAT and below. However, GRT/BTC may cross above the upper boundary of the channel, if the bulls manage to stay well above the moving averages, therefore, the Graph price may locate the resistance at 1000 SAT and above.
The Graph Alternatives
The Graph price may begin to follow the bullish movement as shown on the daily chart, but the bulls may need to push the coin above the resistance level of $0.175, if not, the Graph may head to the south. Nevertheless, the MEMAG token is still very hot at the moment as it has raised over $4 million in the presale. Meanwhile, investors that are interested are to move quickly before it expires.
Meta Masters Guild – Play and Earn Crypto

- Innovative P2E NFT Games Library Launching in 2023
- Free to Play – No Barrier to Entry
- Putting the Fun Back Into Blockchain Games
- Rewards, Staking, In-Game NFTs
- Real-World Community of Gamers & Traders
- Round One of Token Sale Live Now – memag.io

Join Our Telegram channel to stay up to date on breaking news coverage
Credit: Source link


