The financial world has long relied on traditional indicators to gauge market health and predict future trends. Among these, the 30-year fixed mortgage rates and the 30-year Treasury yield are pivotal markers.
The spread between these two metrics has recently garnered significant attention, reaching historical highs and prompting discussions about its implications for the broader market.
The 30-year fixed mortgage rate represents the interest rate lenders charge for a 30-year loan used to purchase real estate. This rate is crucial for several reasons.
Firstly, it directly impacts homeowners’ monthly payments, influencing decisions on home purchases and refinancing.
Secondly, it serves as a reflection of lenders’ confidence in the economy’s long-term stability. A higher rate often indicates perceived risks in the housing market or broader economic uncertainties.
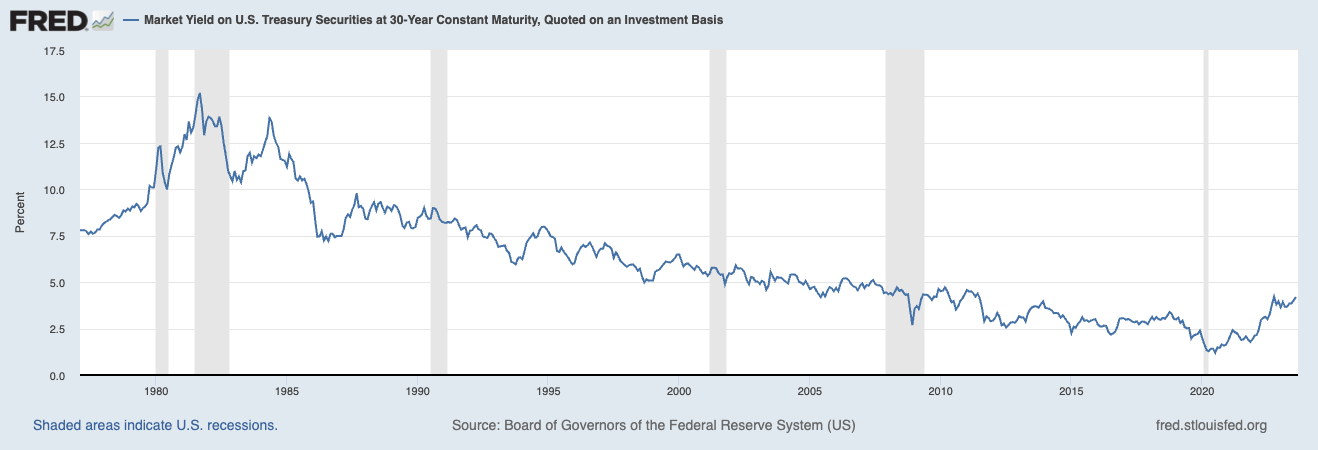
The 30-year Treasury yield is the return on investment for a U.S. government bond maturing in 30 years. Deemed one of the safest investments, the full faith and credit of the U.S. government backs it. This yield is a benchmark for other interest rates and provides insights into investor sentiment about future economic conditions.
A lower yield typically suggests that investors are seeking safer assets, possibly due to concerns about economic downturns or geopolitical tensions.

The difference between the 30-year fixed mortgage rate and the 30-year Treasury yield is known as the ‘spread.’ This spread is a barometer for credit tightness in the system. A widening spread suggests that while government securities remain a safe bet, the housing market is perceived as riskier.
Conversely, a narrowing or low spread indicates that the perceived risk between the two is minimal. This could signify a stable housing market and a strong economy, where lenders see mortgage lending nearly as safe as government-backed securities.
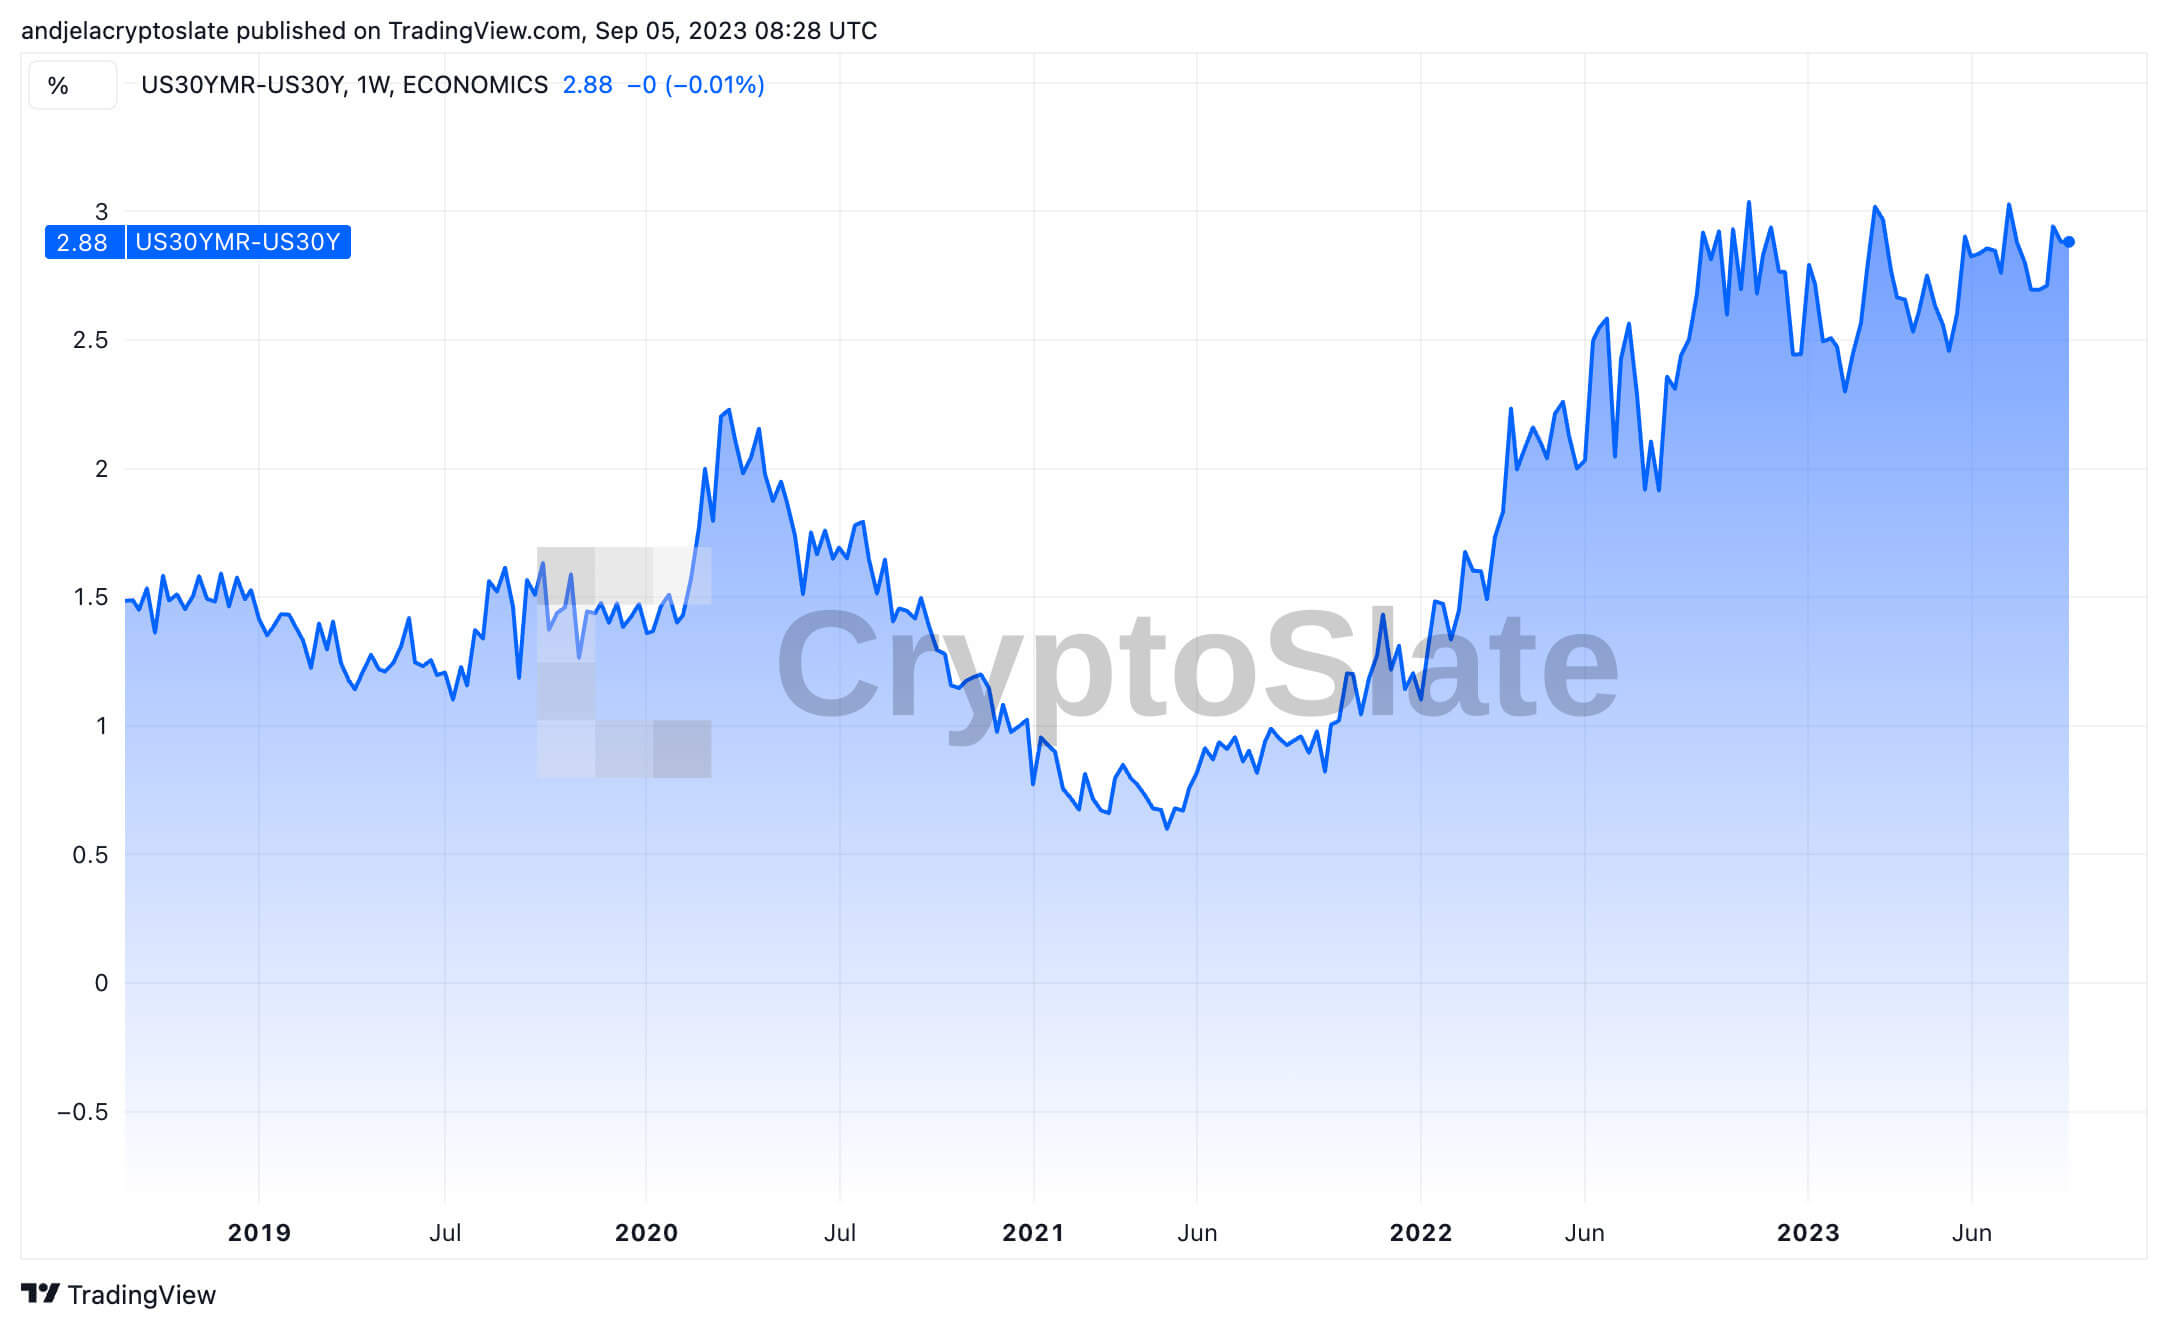
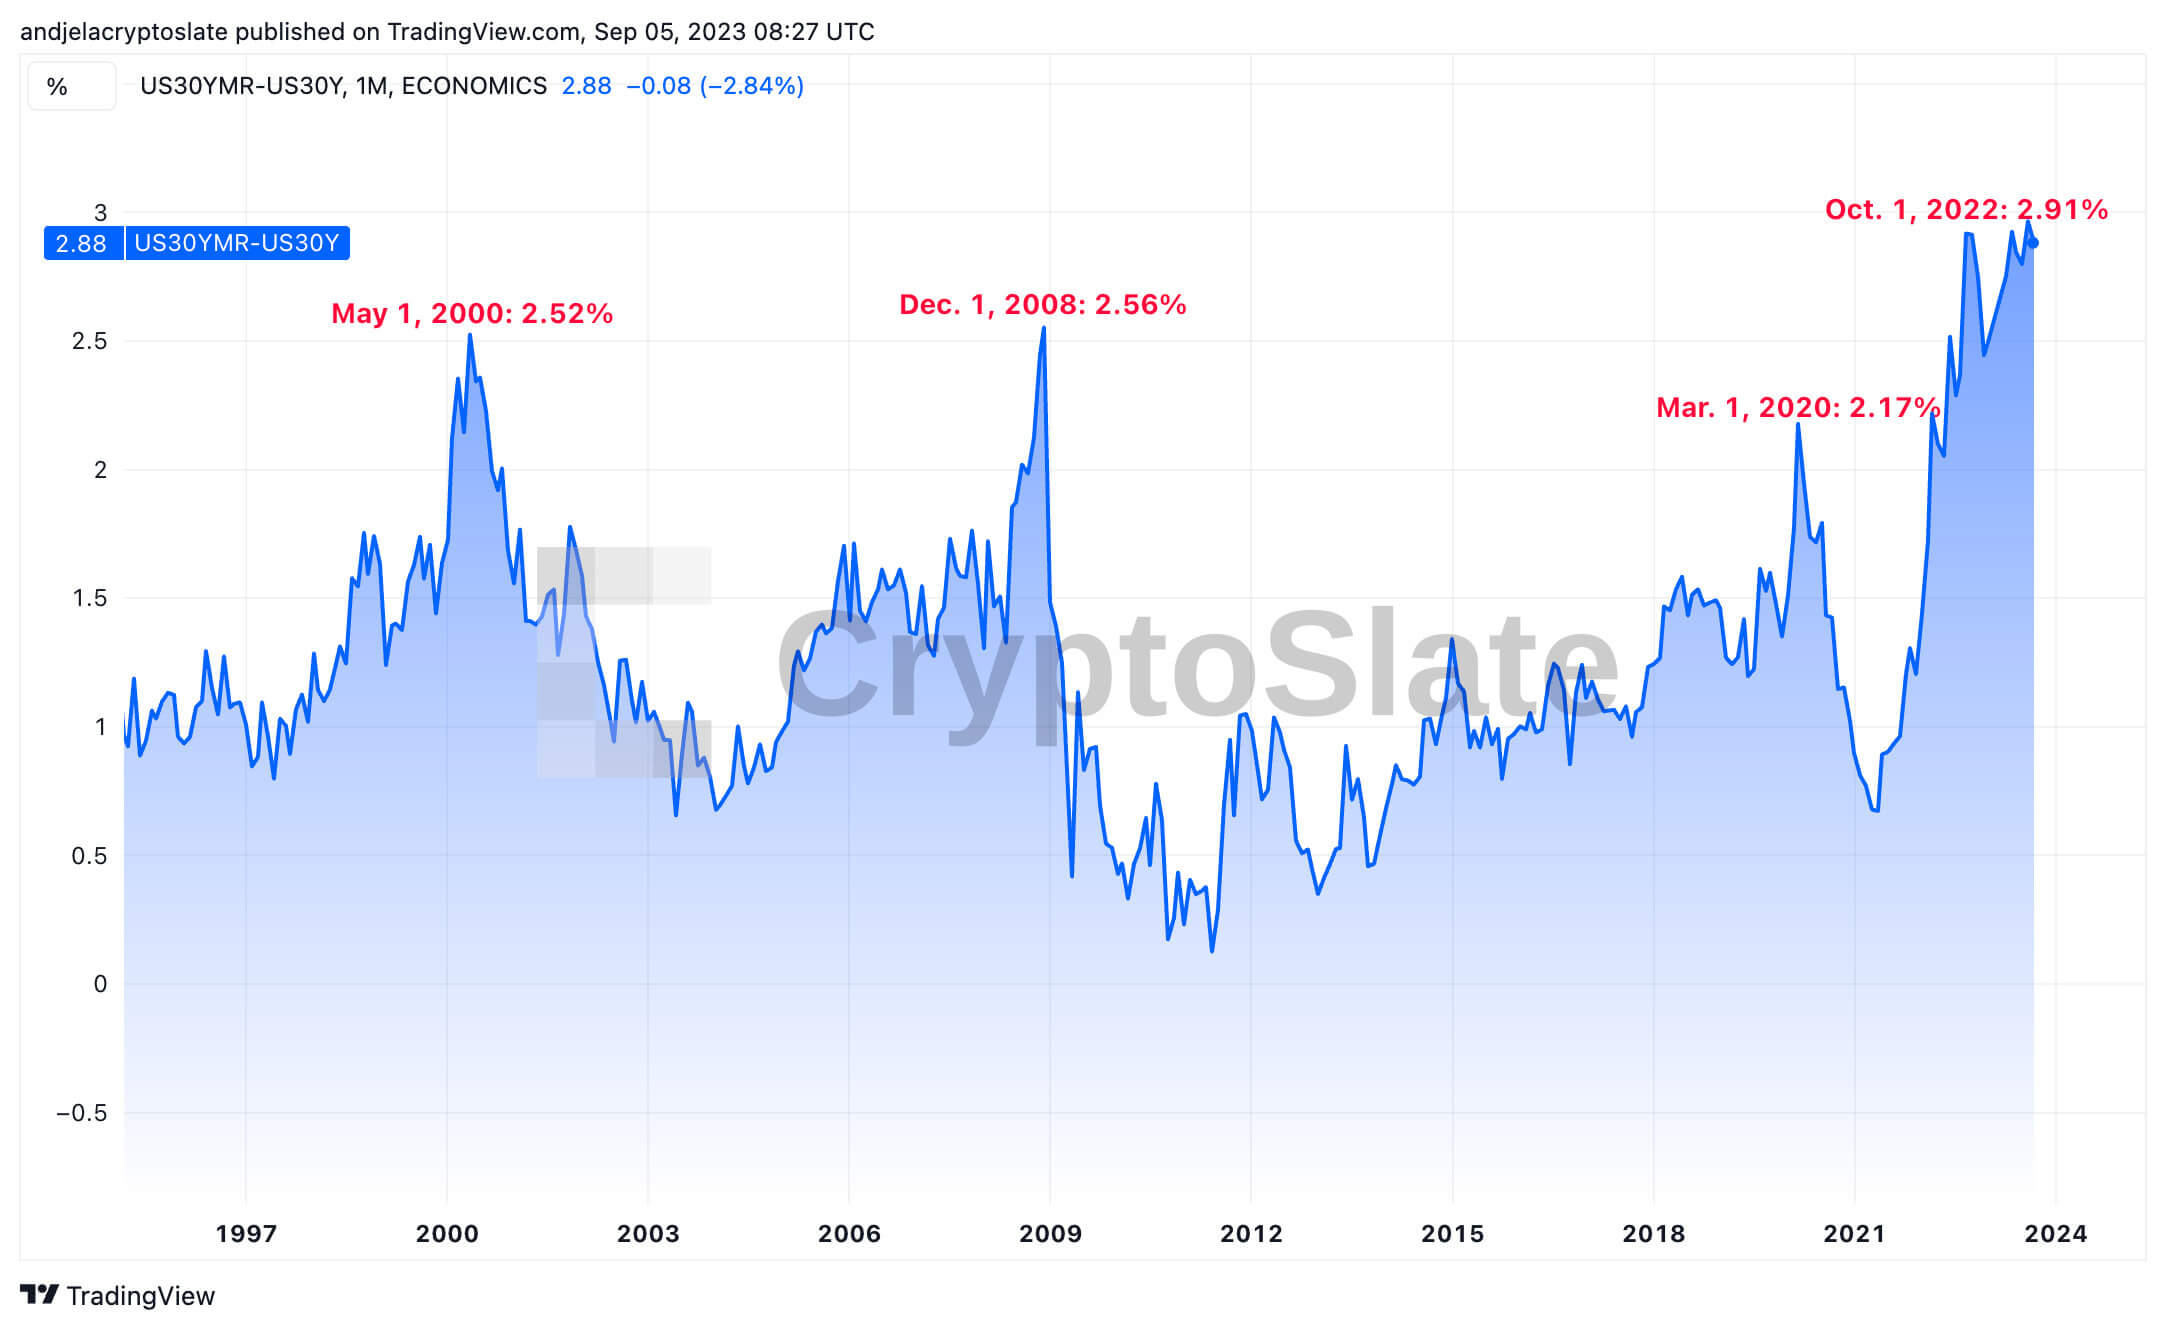
The record low for the spread was 0.11%, reached on June 1, 2011. More recently, on May 1, 2021, the spread dipped to 0.67%, shortly after peaking at 2.17% on March 1, 2021. Such lows suggest periods of heightened confidence in the housing market, with lenders viewing it as almost on par with the safety of government bonds.
The spread hit an all-time high of 2.97% on Aug. 1, 2023, followed by a slight dip to 2.88% on Sept. 5, 2023.

Previous peaks include 2.91% on Oct. 1, 2022, 2.17% on March 1, 2020, 2.56% on Dec. 1, 2008, and 2.52% on May 1, 2000.

- Oct. 1, 2022 (2.91%): Given that the previous ATH was recorded less than a year ago, it suggests that the trend of a widening spread has been ongoing for a while.
- Mar. 1, 2020 (2.17%): The global economic downturn and uncertainties associated with the pandemic likely made lenders more risk-averse, leading to a broader spread.
- Dec. 1, 2008 (2.56%): A massive spike in the spread was recorded during the global financial crisis. The global economy faced an unprecedented downturn, with banks and financial institutions facing severe challenges. The wider spread reflects the heightened risk and uncertainty of that period.
- May 1, 2000 (2.52%): An uncharacteristically widespread was recorded when the dot-com bubble burst. The wider spread indicates that lenders perceived higher risks in the housing market, possibly due to economic uncertainties stemming from the collapse of many tech giants.
The spread between the 30-year fixed mortgage rate and the 30-year Treasury yield offers invaluable insights into the economy’s health and investor sentiment.
Its recent surge to near-historical highs suggests a cautious approach by lenders and could signal a shift in investment strategies. Given the uncertainness in traditional markets, investors may turn to alternative assets such as cryptocurrencies.
Bitcoin, in particular, could see increased activity as it offers potential hedging opportunities against traditional market volatilities.
The post Mortgage-treasury spreads hit historical highs revealing Bitcoin opportunity appeared first on CryptoSlate.
Credit: Source link


