RUNE Avoids Bear Trap, Soon To $2?
The RUNE price action displays a phenomenal rising channel pattern in the daily chart. Following the 90% jump in August, the Thorchain coin price continues to sustain a bullish trend in motion.
Currently, the altcoin displays a year-to-date growth of 33% despite a highly volatile year. Due to such sharp moves and the overall positive trend, the RUNE price prediction sustains a bullish outlook in the coming months.
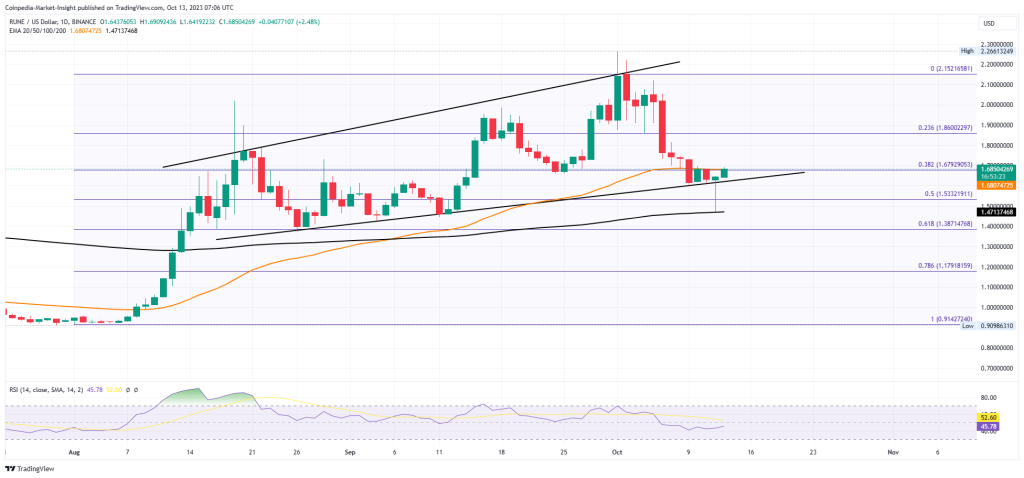
The RUNE price is currently trading at $1.68 and tests the 38.20% Fibonacci level. Furthermore, the Thorchain prices recently took a bounce from the support trendline while making a long tail formation to avoid a downfall.
With such a long tail candle and the intraday jump of 2.75%, the price action displays a morning sharp pattern ready to reclaim the 50-day EMA. Considering the prices managed to sustain above the 50-day EMA, the buyers prepare for a bullish trend to challenge the overhead resistance trend line.
Such a bullish reversal in RUNE price within the channel sustains the uptrend possibility.
Technical indicators:
RSI indicator: The daily RSI line moves sideways as the market value takes support and prepares for a bounce back. However, the RSI fails to showcase any bullish divergence.
EMA: The 20-day EMA provides a cushion to avoid a downtrend continuation and pumps the RUNE price above the trendline. Following the golden crossover, the 50-day and 200-day EMAs maintain a positive alignment.
Will RUNE Price Sustain Above The 50-Day EMA?
Considering the bullish momentum manages to restart the bull positive cycle, the uptrend may face opposition at $1.86 and $2.15. On an even more optimistic note, the overhead trendline breakout can fuel the breakout rally to $2.50.
On the flip side, a bullish failure leading to the trend line breakout will test the 200-day EMA close to the psychological mark of $1.50.
Credit: Source link