These 2 Blue-chip Altcoins To Surge 25% Amid Bullish Recovery?
With a drop of 1.45% within the past day, the cryptocurrency market is currently valued at $2.07 Trillion. Moreover, the market leader, Bitcoin price has retested its low of $56K during the early Asian trading hours and is currently valued at $58,523.63.
Moreover, blue-chip altcoins have displayed a similar price action by plunging toward their important support levels. With this, questions like “Is this the right time to invest in Altcoins?” and “Has crypto market correction bottomed out?” are on a constant rise.
Dive in as, in this article, we have covered the top 2 altcoins that have the potential to record to massive uptrend in their respective portfolios amid cryptocurrency bullish recovery.
Bitcoin Cash On The Verge Of Testing Its Important Support Level:
The BCH price has recorded a correction of 1.21% with a trading volume of $298.12 Million, a change of +46.543%. Moreover, it has continued trading under a bearish sentiment by dropping approximately 1% over the past week and 11.82% during the past 30 days.
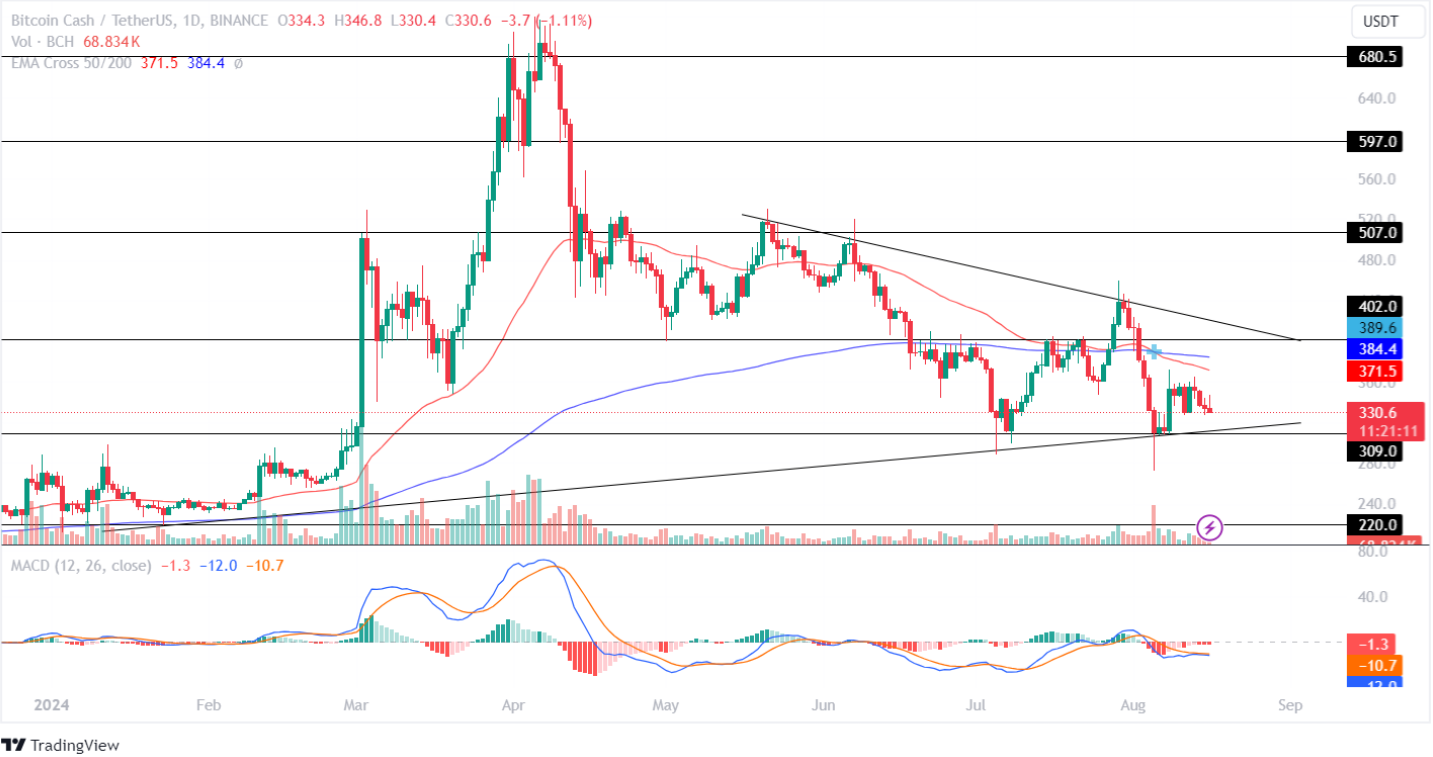
The EMA 50/200-day displays a negative trend with a Death Cross in the 1D time frame. This indicates a negative influence on the Bitcoin Cash price in the crypto market.
Further, the MACD records a constant red histogram with its averages showing a high possibility of a bearish convergence. This suggests that the altcoin will continue losing value this week.
Suppose a bullish reversal occurs, in that case, the BCH price will regain momentum and prepare to test its important resistance level of $402 in the coming time. Conversely, if the bears continue to dominate the market, it will plunge toward its support level of $309.
Chainlink Price Displays Increased Bearish Sentiment:
With the rising bearish sentiment in the crypto space, the Link price has plunged over 28% over the past 30 days. Moreover, it has a YTD return of -31.89%, indicating a long-term negative influence. Further, with a market cap of $6.20 Billion, it has secured the 16th position in the global crypto-list.
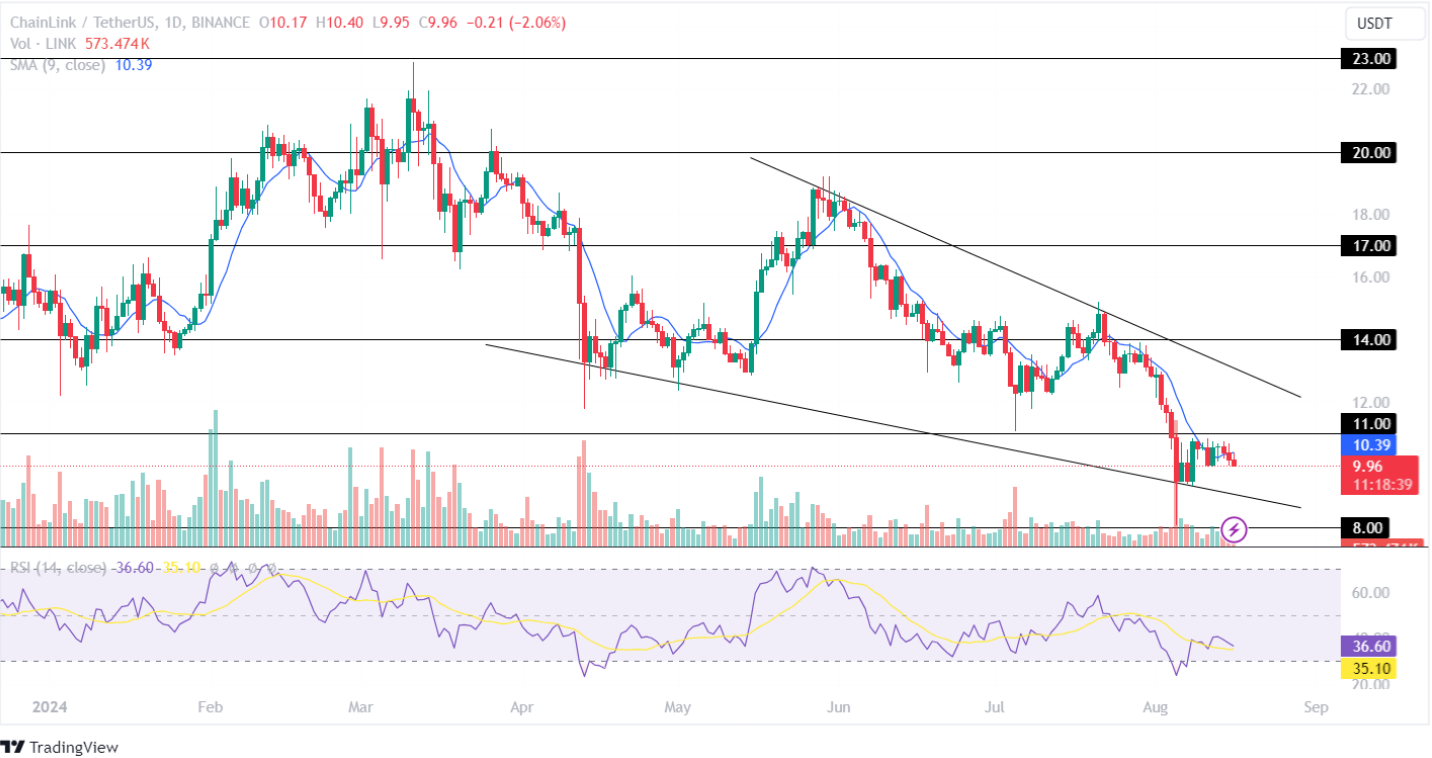
The Simple Moving Average (SMA) has recorded a bearish crossover in the 1D time frame, suggesting weak buying and selling pressure for the altcoin in the crypto market.
On the other hand, the RSI shows a constant decline above its oversold range with a potential negative crossover in the Chainlink price chart. This indicates uncertainty in future price action.
If the market pushes the LINK price above its resistance level of $11, the bulls will regain momentum and prepare to test its upper resistance level of $14 in the coming time. However, a bearish action could pull the Chainlink price toward its new yearly lows.
Credit: Source link