Top Tokens To Retest Their Crucial Support?
The crypto market has constantly traded under a bearish sentiment for a brief period, indicating an increase in the selling pressure within the crypto space. Moreover, the market leader, BTC price has failed to hold its value above the $65,000 mark.
Following in its footsteps, the altcoin leader, the Ethereum token has recorded a consolidated price action over the past week. Further, Ripple’s XRP coin price has also failed to hold its value above its important support trendline of $0.50.
With the rising bearish sentiment among the top cryptocurrencies, will market leaders make a comeback during the upcoming week or plunge toward their respective crucial support levels?
Bitcoin (BTC):
The BTC price continues to display a weak price action by recording a correction of approximately 1% within the past day with a change of -61.28% in its trading volume. Moreover, it has dropped 2.48% within the past seven days and 7.22% over the past 30 days.
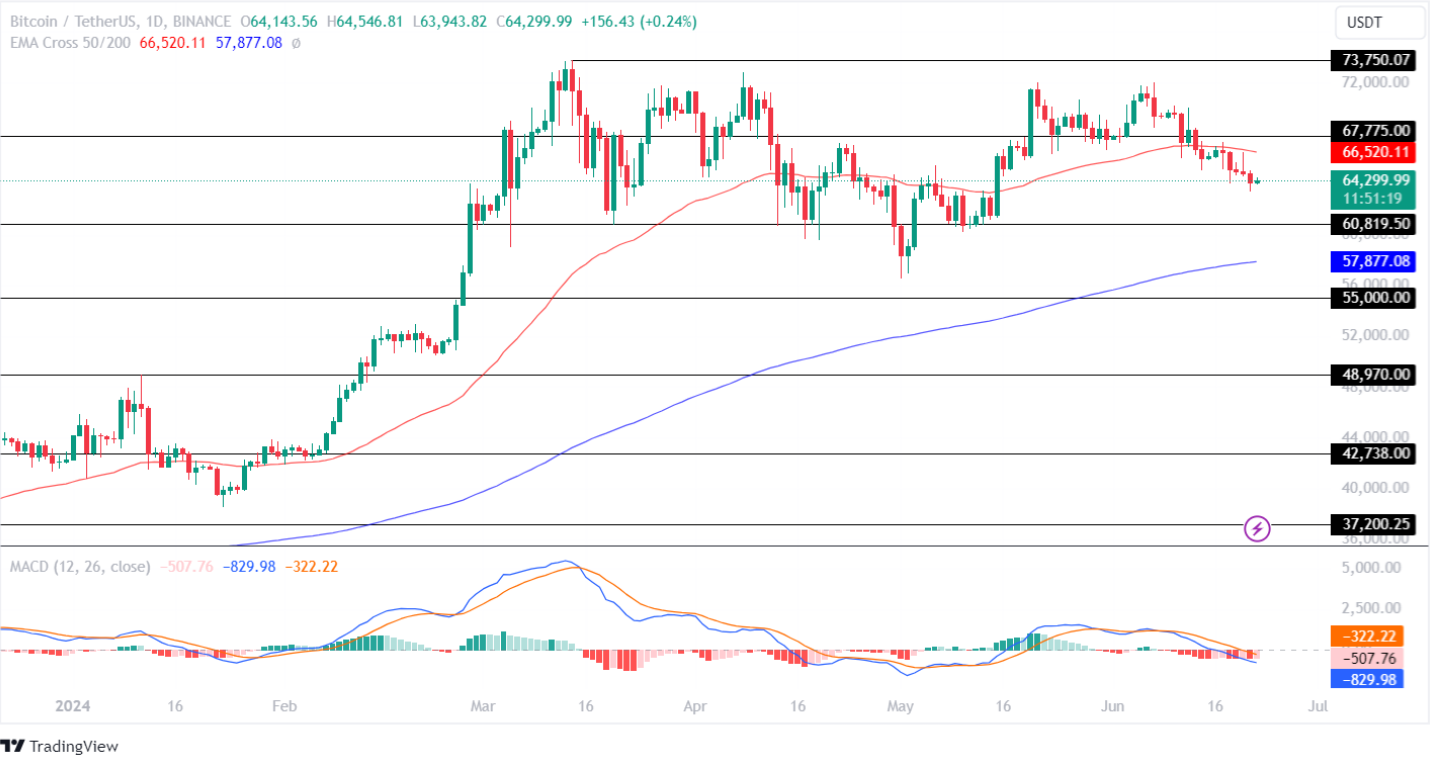
The EMA 50-day constantly acts as a resistance to the Bitcoin price chart in the 1D time frame, suggesting a weak price action for the star crypto in the market.
The technical indicator, MACD, has recorded a constant decline in the red histogram. However, its averages continue to display a downtrend, suggesting a mixed price sentiment.
If the market regains momentum, the BTC coin price will retest its resistance level of $67,775 in the coming time. Conversely, if the bears continue to dominate the market, the price of Bitcoin will plunge toward its important support level of $60,819.50.
Ethereum (ETH):
After displaying a sideways for over a week, the ETH price has formed a symmetric triangle pattern in the 1D time frame. Moreover, with a drop of 1% in valuation within the past 24 hours, the altcoin is on the verge of testing its support trendline with an unpredictable outcome.
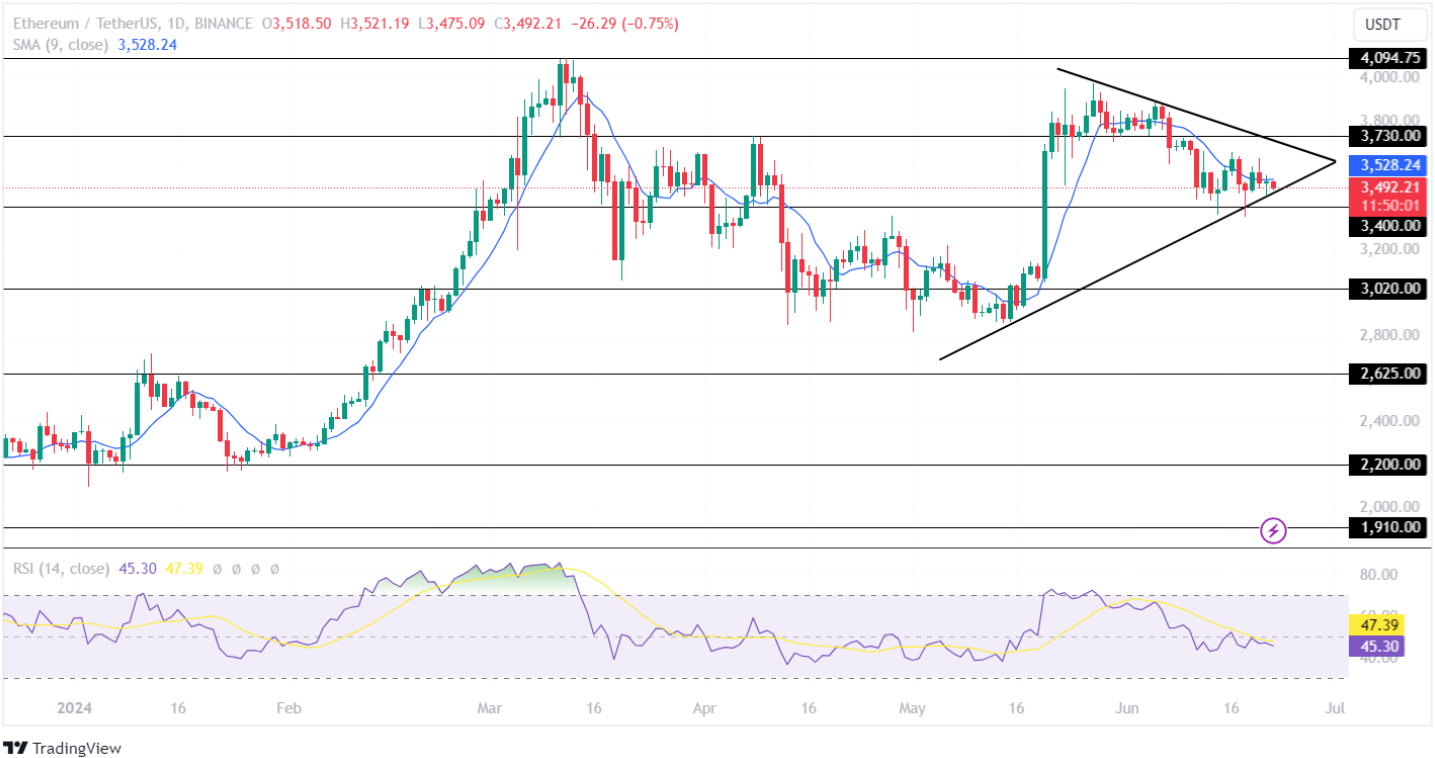
The Simple Moving Average (SMA) has displayed a bearish trend in the Ethereum price chart, highlighting a weak bullish sentiment in the crypto space.
Moreover, the RSI indicator continues to display a constant decline with its average dropping below the mid-point. This indicates a rising disinterest of investors in this altcoin.
If the bulls regain control over the bears, the Ethereum crypto will head toward its resistance level of $3,730 soon. However, if the bears dominate the market, the ETH price will break down its support trendline and plunge toward its low of $3,000.
Ripple (XRP):
Since mid-April, the XRP coin price has displayed a weak price action by trading in a closed range between $0.480 and $0.5340. Moreover, the altcoin has displayed a change of less than 1% within the past seven days, with a 24-hour trading volume of $425.82 Million, a drop of -60.63%.
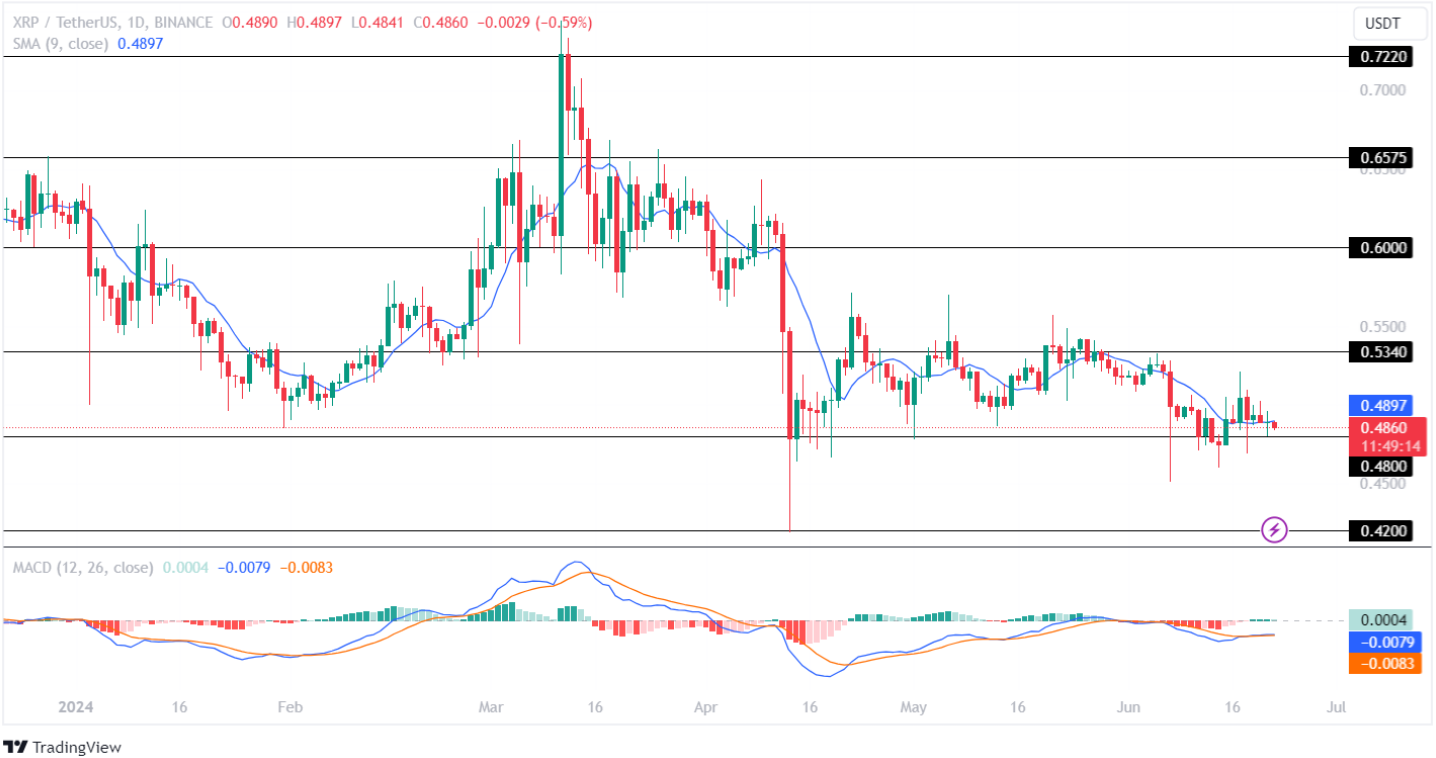
The Moving Average Convergence Divergence (MACD) has displayed a constant flatline in its price chart, indicating weak buying and selling pressure for the XRP token in the cryptocurrency market. Moreover, the averages show a neutral trend, suggesting uncertainty in future price action.
If the market holds the Ripple price above its crucial support level of $0.480, the bulls will regain momentum and prepare to test its important resistance level of $0.5340. On the flip side, if the bulls fail to regain momentum, the XRP crypto will bleed toward its low of $0.420 during the upcoming weeks.
Credit: Source link