Join Our Telegram channel to stay up to date on breaking news coverage
The Ripple price prediction shows that XRP is currently pushing higher with 4.19% gains as the coin manages to face the north.
Ripple Prediction Statistics Data:
- Ripple price now – $0.46
- Ripple market cap – $24.3 billion
- Ripple circulating supply – 51.7 billion
- Ripple total supply – 99.98 billion
- Ripple Coinmarketcap ranking – #6
XRP/USD Market
Key Levels:
Resistance levels: $0.55, $0.60, $0.65
Support levels: $0.37, $0.32, $0.27
Looking at the daily chart, XRP/USD manages to reach a daily high of $0.47 as the market opens today. During the European session, the Ripple price moved toward the 9-day and 21-day moving averages. Meanwhile, the push to the upside allows XRP/USD to climb back to the positive side. This bounce toward the moving averages shows that the buyers may come to play out in the market.
Ripple Price Prediction: Ripple Price Ready for the Upside
The Ripple price may continue to follow the uptrend as the coin needs to see a shift in momentum, which may continue to push the market price toward the north. However, the nearest resistance level could be established above the 9-day and 21-day moving averages. Therefore, a bullish breakout toward the upper boundary of the channel could take the Ripple price to the potential resistance levels at $0.55, $0.60, and $0.65 while the technical indicator Relative Strength Index (14) remains above the 40-level.
However, XRP/USD is trading at $0.46 after holding above $0.47; a bearish movement towards the lower boundary of the channel may cause the Ripple price to revisit the downside which could hit the support levels at $0.37, $0.32, and $0.27 respectively.
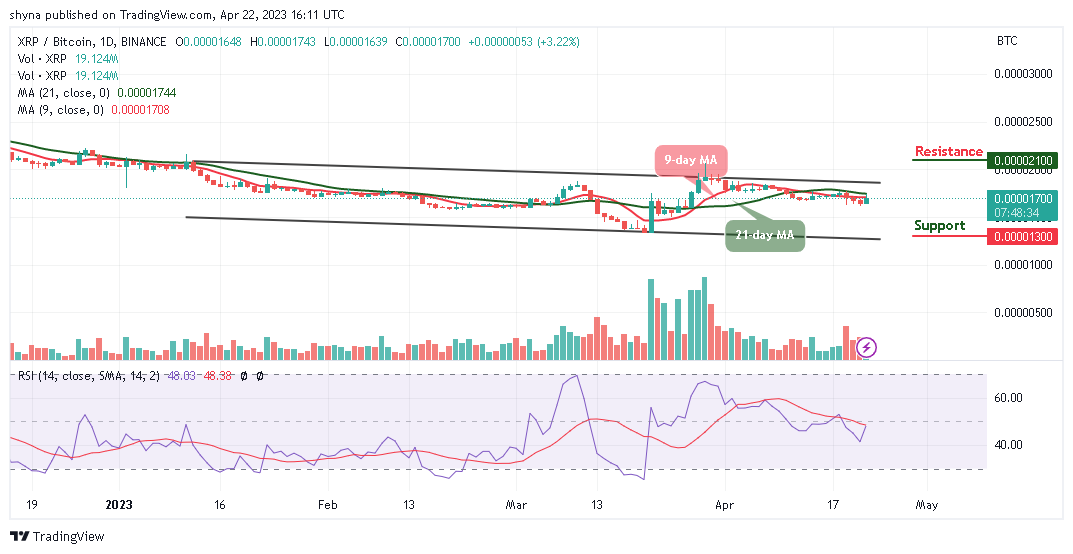
Against Bitcoin, Ripple (XRP) is still demonstrating a positive sign toward the 9-day and 21-day moving averages. The trend is likely to follow the bullish movement in the long term and breaking above the channel could take the coin to higher levels. Meanwhile, XRP/BTC is currently changing hands at 1700 SAT below the 9-day and 21-day moving averages.

Nevertheless, the resistance level is located around 2100 SAT and above but any bearish movement may bring the coin to the closest support level at 1300 SAT and below. Moreover, the technical indicator Relative Strength Index (14) is moving to cross above the 50-level, suggesting a bullish movement for the market.
Ripple Alternatives
As the Ripple price is hovering toward the 9-day and 21-day moving averages within the channel. However, a sustainable move above this barrier may improve the bullish movement and allow for an extended recovery toward the resistance level of $0.55. However, investors are also understanding that Love Hate Inu (LHINU), a new Vote-to-Earn meme coin, could provide even more impressive returns. That’s why the new platform has raised more than $5.5 million in presale thus far, even though it hasn’t been live for all that long.
Love Hate Inu – Newest Meme Coin
- Decentralized Polling – Vote to Earn
- Early Access Presale Live Now
- Ethereum Chain
- Featured in Yahoo Finance
- Mint Memes of Survey Results as NFTs
- Staking Rewards
- Viral Potential, Growing Community
Join Our Telegram channel to stay up to date on breaking news coverage
Credit: Source link


